
<>

This time we are going to talk about Gini index For this, we will make a brief introduction about what it is index is he numerical representation of existing variations Regarding a phenomenon of any type, the phenomena can be of any type, but its main conclusion is a graph that determines at a glance all the statistical data, this with the purpose of disseminating and / or understanding the information.
Un índice de desigualdad es la medida que resume la forma en que se distribuye una variable, cualquiera que be, entre un recopilatorio de individuos. En el caso de la desigualdad económica, la variable de medida suele ser el gasto de las familias, convivientes o particulares. El estadístico italiano Gini propagationI devise an indicator whose use is to measure the level of inequality among the existing inhabitants of a specific region. Unlike the index, the coefficient is calculated as part of a proportion of the areas in the diagram of the well-known «Lorenz curve»
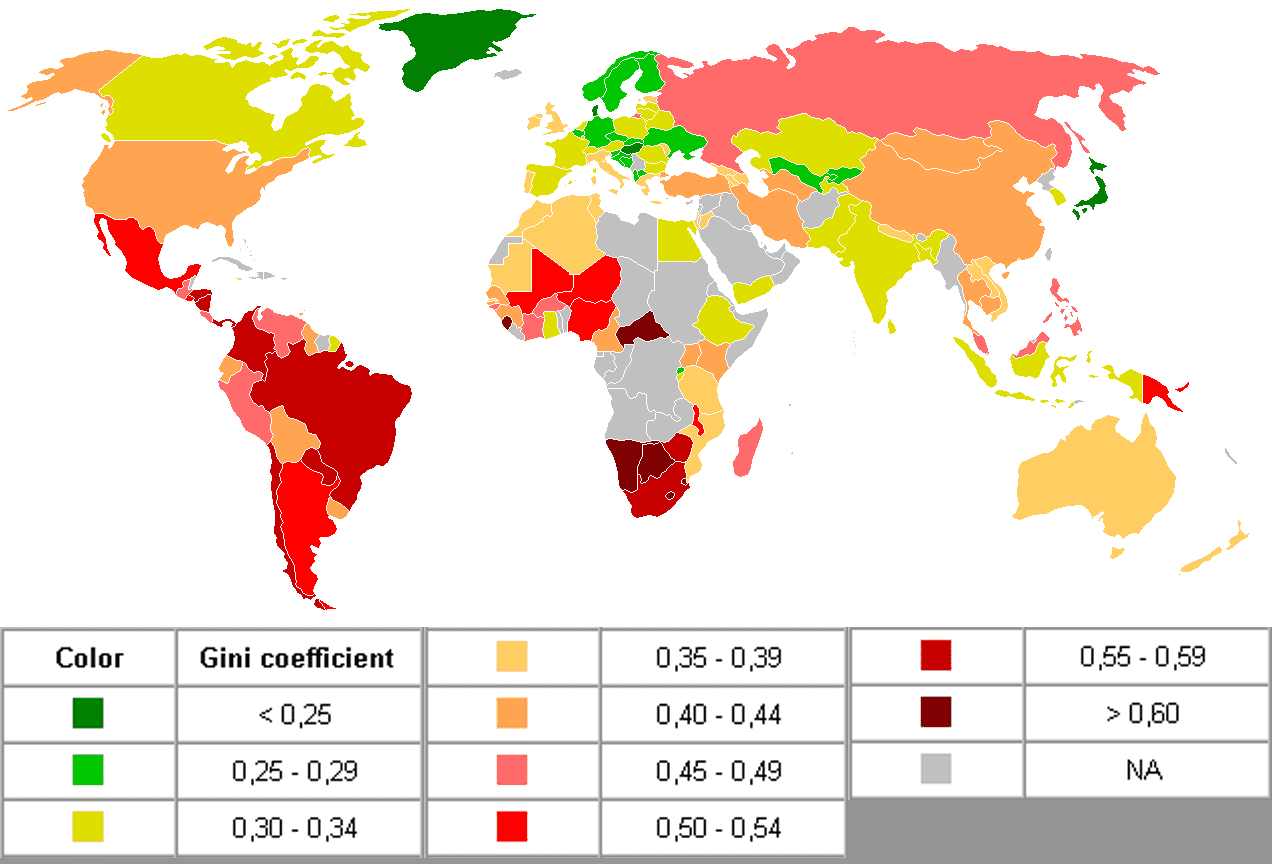
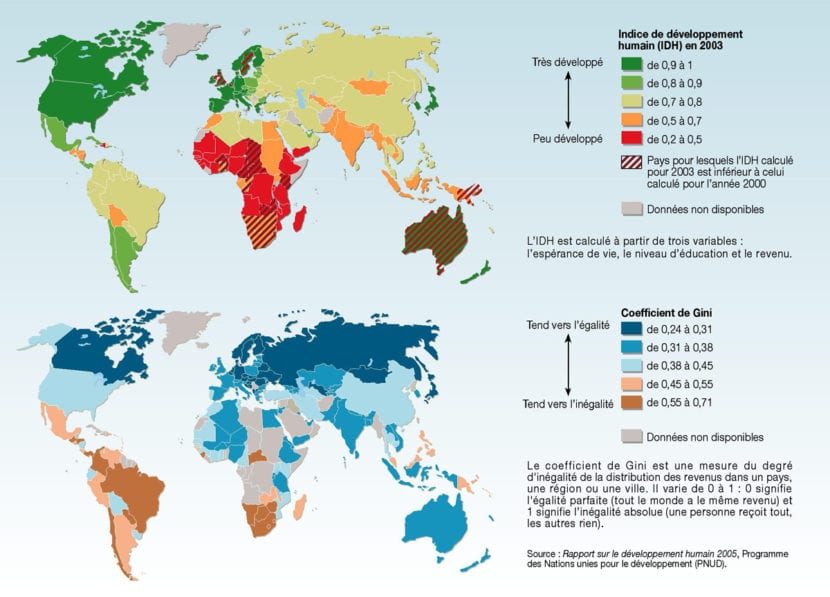
The Gini coefficient comprises a number between 0 and 1, where 0 corresponds to perfect equality, where everyone has the same income, while the numerical value 1 corresponds to perfect inequality, where only one individual has income and everyone else has none. The Gini Index is the Gini coefficient, but expressed in reference to a maximum of 100, unlike the coefficient that corresponds to decimal numerical values that exist only between 0 and 1, this is to speed up the understanding of the graphs, thus such as the dissemination of the results obtained.
Within the classification of inequalities there are two large measures that are used in the literature, these groupings are: positive measures, which correspond to those that do not refer to social welfare. Although there are also normative measures, which, unlike positives, focus on a direct welfare function. Depending on the chosen indicator, the norms or parameters with which the observed income distribution is compared are defined.
Part of the properties of the Gini index or Gini coefficient are:

- An established integral is regularly used to establish the area between the line of perfect equity and the Lorenz curve, this is considered the ideal process, however, there are also cases in which the explicit definition of the Lorenz curve is not known. In this way, other methods are used, such as several formulas with a finite number of addends, the procedures and formulas vary depending on the consideration of the case.
- Although the desired result is a graph that presents the inequality indices in a simple and practical way, it is not highly recommended that a visual evaluation be carried out when it comes to two Lorenz curves, since this evaluation may be erroneous, on the other hand, It is recommended to compare the inequality that each represents separately, calculating the Gini indices corresponding to each curve.
- Any Lorenz curve or rather; all Lorenz curves pass through the curve or line joining the points at the following coordinates: (0, 0) and (1, 1)
- The table of coefficients of variation has properties comparable to those of the Gini index.
The Lorenz curve.
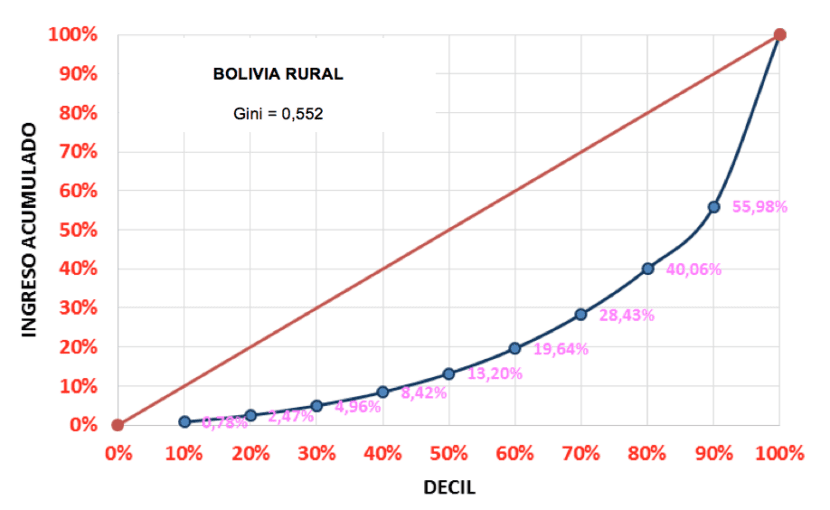

La curva de Lorenz es la representación gráfica utilizada para representar la distribución relativa de una variable dentro de un domain dado. Comúnmente, el dominio en el que se refleja esta curva es una representación de un recopilatorio de bienes o servicios en una región, esto a través de la aplicación de la curva de Lorenz en conjunto con el índice de Gini o coeficiente de Gini. La autoría de esta curva es Max O. Lorenz in the year 1905.
Link between the Lorenz curve and the Gini coefficient.
Together with the Lorenz Curve we can calculate the Gini index, basically dividing the remaining area between the curve and the "equality" line, this by the total area that remains under the curve. From this dynamic we obtain the coefficient or, in turn, multiplying the result by 100, we obtain the percentage.
Both the Gini index and the Lorenz Curve are developed as methods to identify inequalities between the population of a territory (nation, state, locality, etc.), understanding that the more equity exists among the inhabitants, the greater the approximation of the It curves to a perfect line, while its opposite, a great inequality between the population of a territory, the curve becomes more and more pronounced.
What is the function of the Gini index?

Dentro del estudio de la desigualdad, existe la provisión de diversos y diversas formas de describir la forma en que se distribuyen los ingresos entre los diferentes grupos de individuos de una sociedad o grupo de persons en un territorio, algunos de estos métodos son tales como: ordenamiento de la información, los indicadores de desigualdad y los diagramas de dispersión.
The fact of making a diagram for the visualization of the income distribution is a really useful function for the analysis of the inequality, since it allows us to identify the aspects of the shape of the distribution that with other methods would not be viable or at least would be a more complicated task.
The applications of the Gini index.
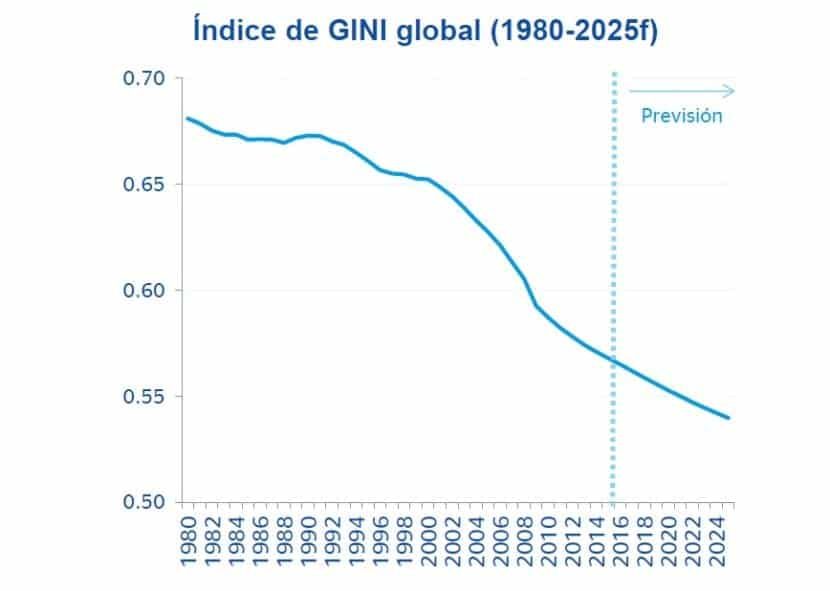
There is a degree of economic inequality in a particular society and the evolution of this society over time becomes a topic of interest to many economists and public opinion in general. There are several analyzes that are carried out in connection with the evaluation of the degree of inequity present in a society. During the history of economic analysis, several indicators have already been proposed for the well-known study of inequality; These, however, have not had such fruitful results as the one known by scholars of the subject as the "Gini Concentration Coefficient". As this index is the easiest to interpret, it is also constantly used as a reference for the debate on the functioning of inequality and its effects on the standard of living of the population of a region.
Among the first works or rather the first work that proposed the use of social welfare functions to measure inequality dates from the year 1920, made by DaltonDuring that investigation, Dalton, proposed to calculate and observe the welfare loss caused by the equitable distribution of income among people. Using a separable, symmetric, additive, and necessarily concave income utility function, Dalton defined what would later become known as the Dalton index.
Considerations about the Gini index.

- Within the theory, 4 ways of producing data ordering are considered, despite this the ones that are used the most with a lot of recurrence are the "frequency distributions" and the "Lorenz curve", the least used, but still very efficient. they are the "parade diagrams" and the "logarithmic transformation."
- What is the indicated variable to measure inequality? Within the empirical work, there is a debate about the variable that could be considered "appropriate" for the evaluation of income concentration. There are two main variables that govern the controversy in this debate; per capita income or the total household income. It could be said that both variables are correct, all in accordance with the need to be covered in terms of the research to be carried out. Therefore, it is necessary to raise in the first instance what is the purpose of such measurement. To continue or proceed to the choice of the variable that corresponds to this particular case.
- Consider the disaggregation of the Gini index. Within the analysis of inequality, decomposition is a central axis, since we must know the origin of the main imbalances that impact equity at a level as basic as the household.
- Despite the popularity and ease of the calculation process, the Gini index is not enough with the property of «additive decomposition”. With this we intend to say that the calculation carried out for a certain subgroup or subgroups will not necessarily always coincide with the value of the ordering coefficient of the total population by income levels.
- What are the data sources to measure inequality? In theory, books and most posts on inequality measurement consider and propose formulas that assume that the income data used is a random sample. This is different in empirical work, since in practice the data are collected from household surveys, in which the identification of observation units is carried out through one or more selection stages and in most cases households with unequal probabilities are chosen. This implies that the coefficient is in fact a mere approximation.