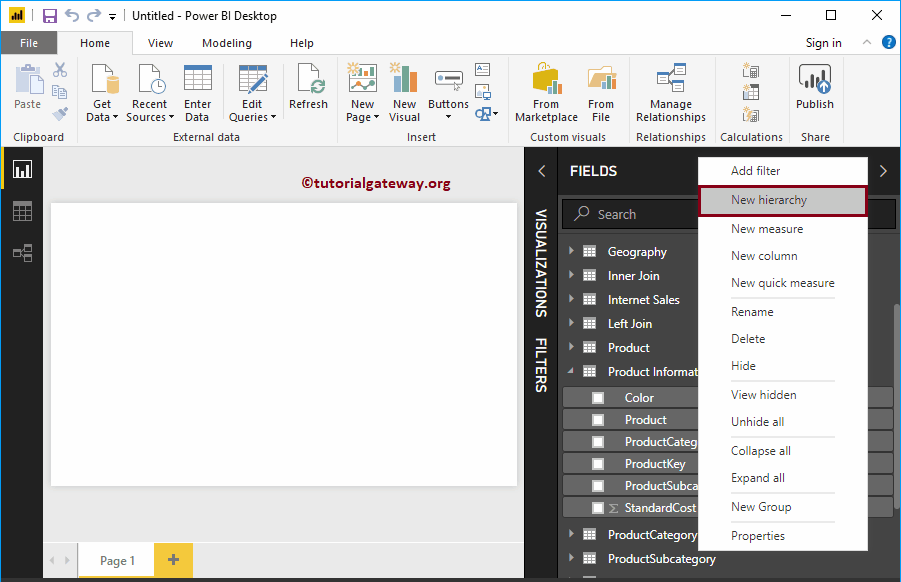
Power BI hierarchies provide you with the drilldown action of the BI report. Let me show you how to create a hierarchy in Power BI reports with an example. How…
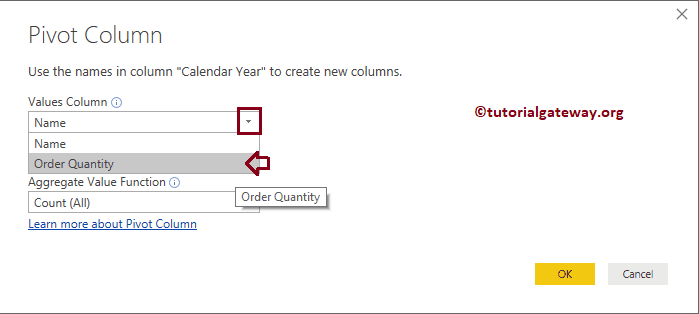
The pivot table option in Power BI converts selected rows to columns. Let me show you how to create a pivot table or how to convert the non-pivot table to a ...
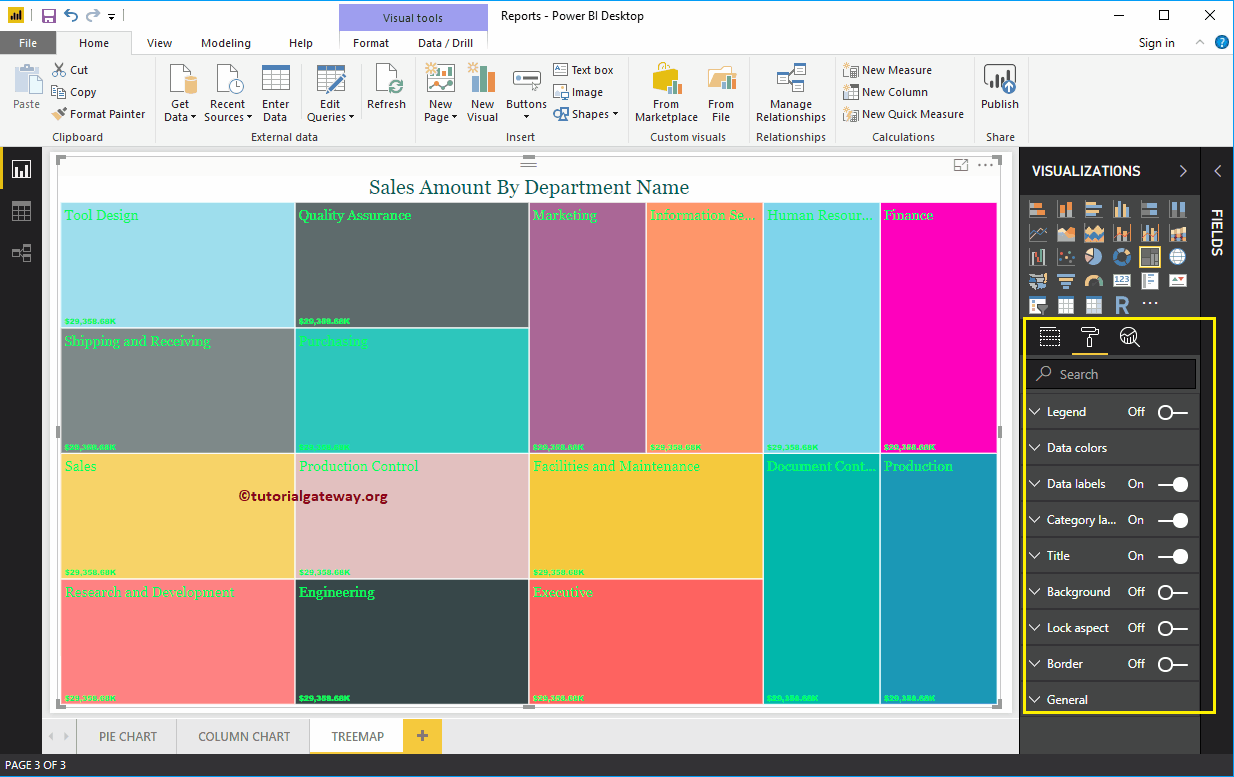
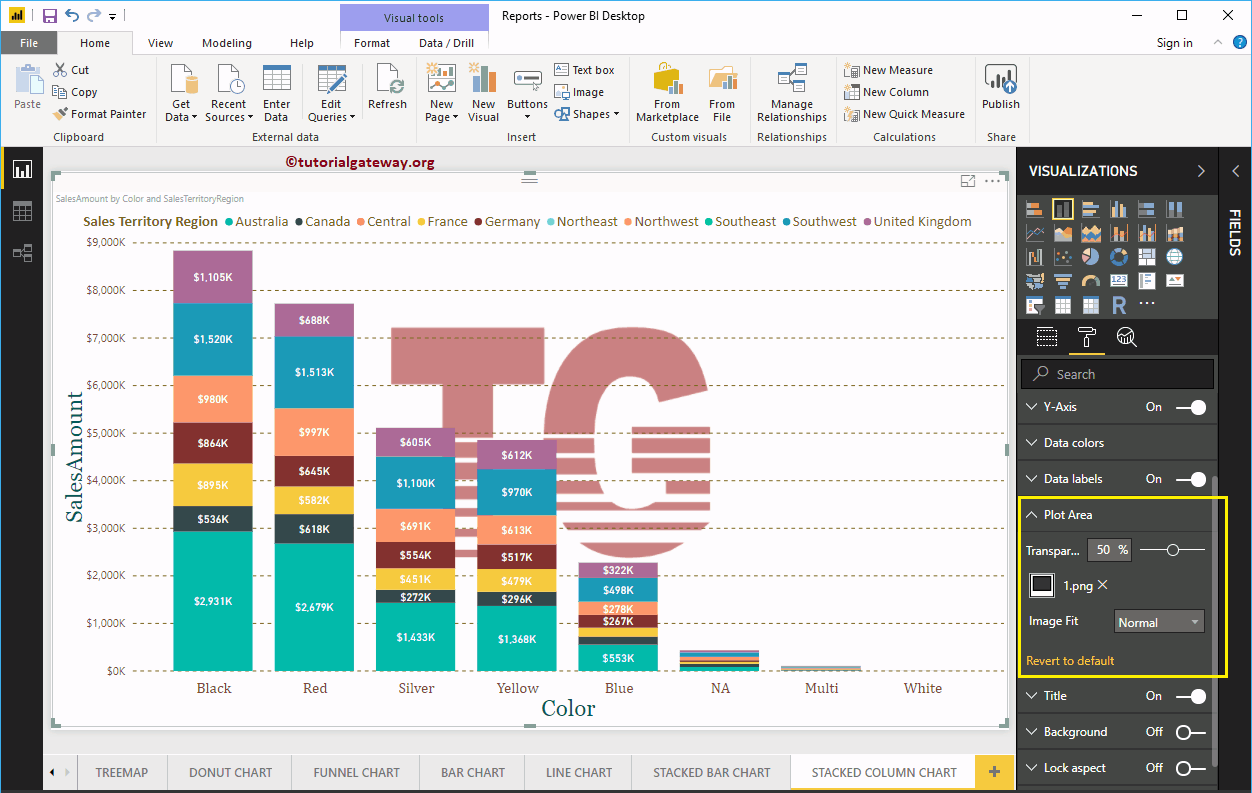
How to format the treemap in Power BI with an example? It includes changing the color of the box, the position of the TreeMap title, the background colors and ...
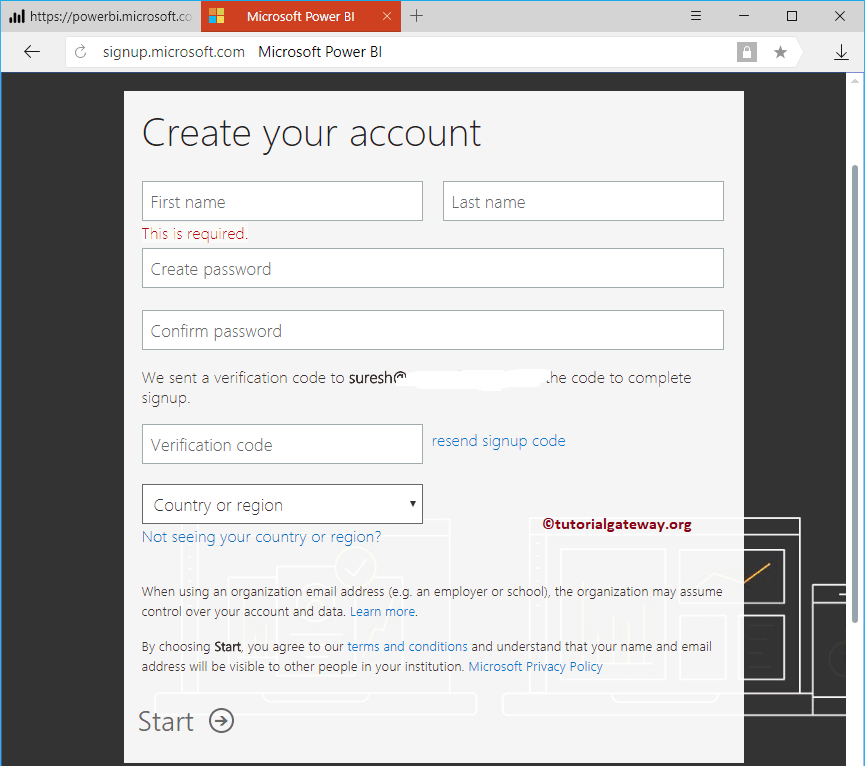
Power BI Desktop is the local version, where you can design your reports. But, in real time, you need to share your work (reports) and dashboards across your organization. To do this, you need ...
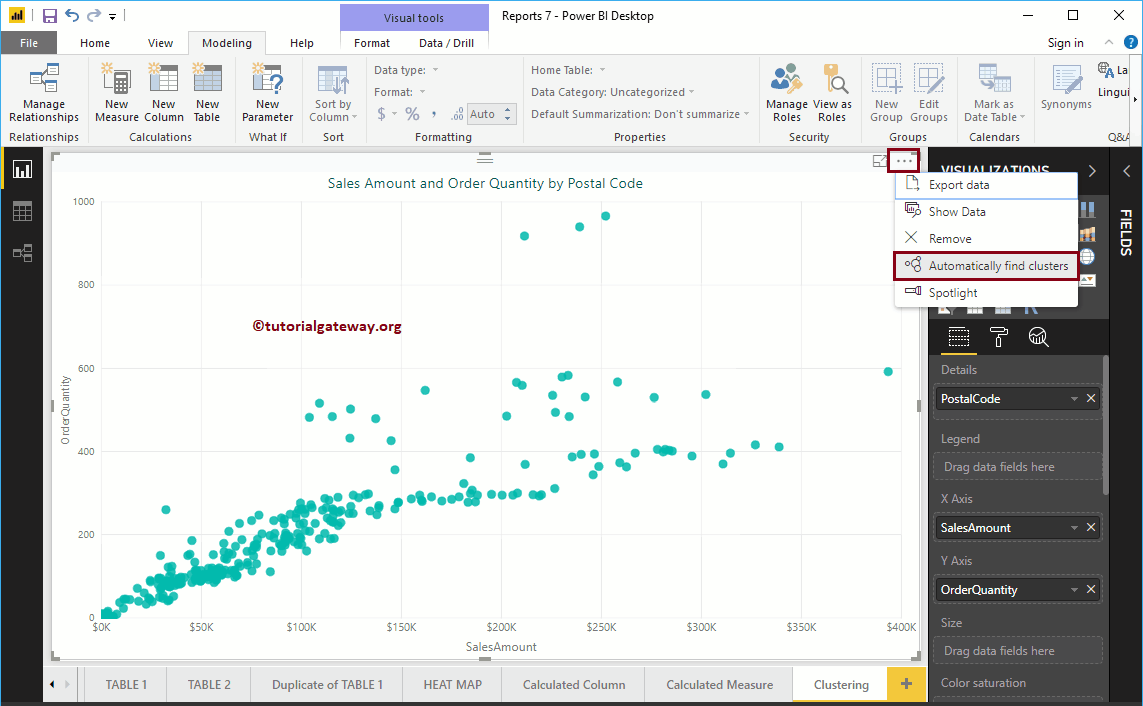
In this section, we show you how to create Power BI clusters with an example. To explain this concept of Clusters, we will use the scatter plot that we created earlier. For this…
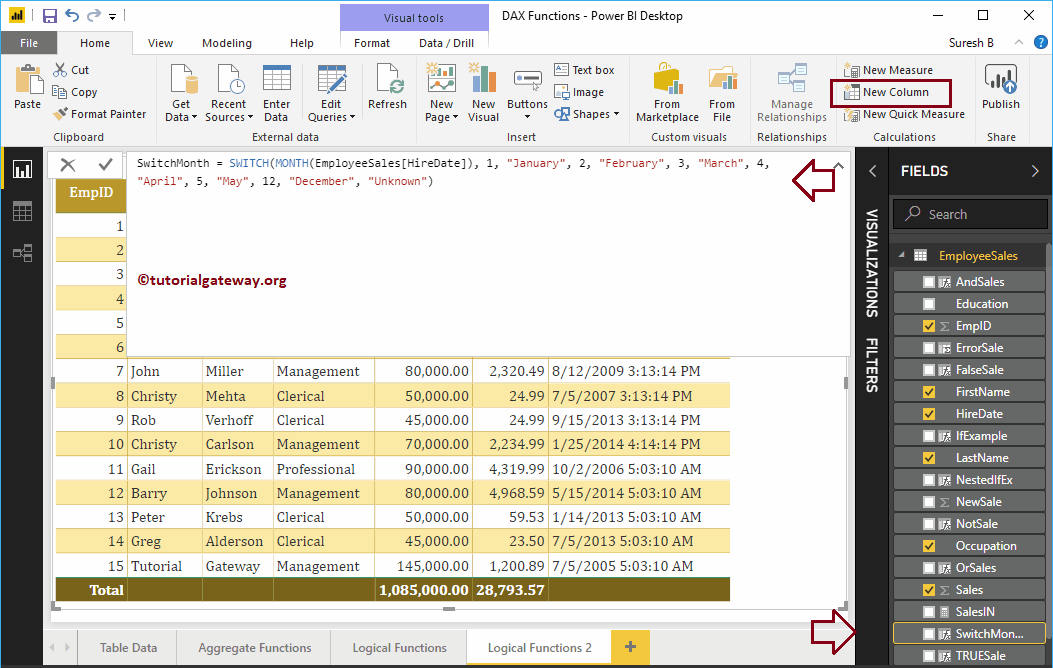
How to use Power BI DAX logical functions with examples? Microsoft Power BI DAX provides several logical functions, such as IF, AND, OR, NOT, IN, TRUE, FALSE, IFERROR, SWITCH, ...