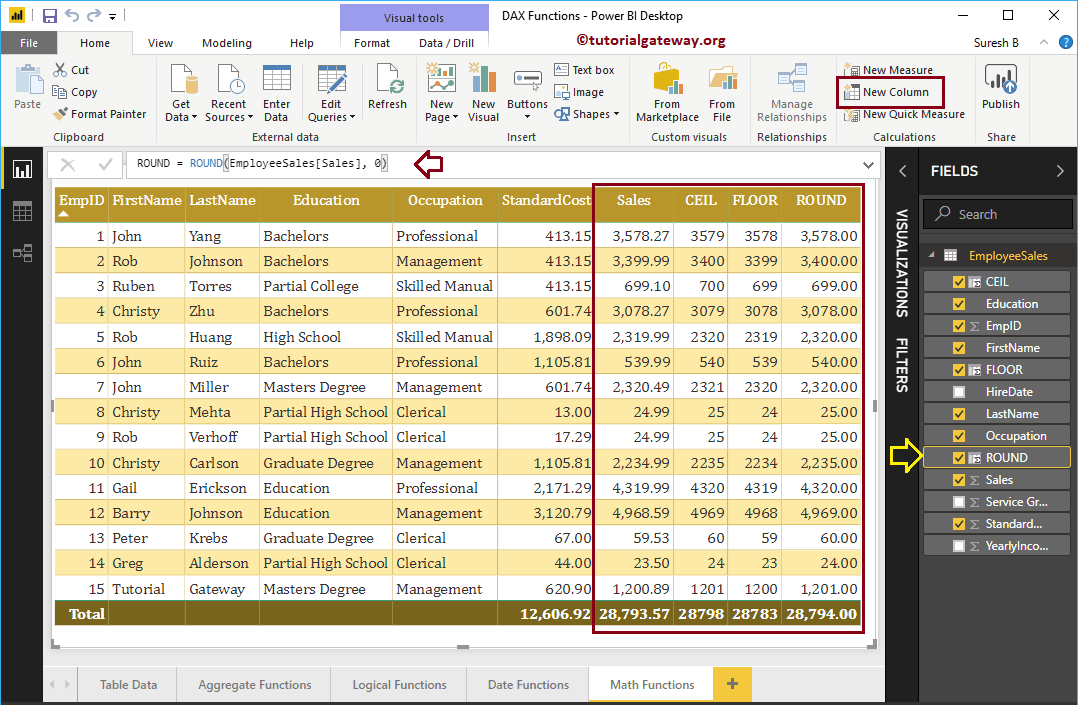
How to use Power BI DAX math functions with examples? Microsoft Power BI DAX provides various mathematical or mathematical functions such as ROOF, FLOOR, CURRENCY, INT, SQRT, POWER, MOD, DIVIDE, ...
How to use DAX aggregate functions in Power BI with examples? Microsoft Power BI DAX provides various aggregate functions, which allows us to perform aggregations such as calculating sum, average, ...
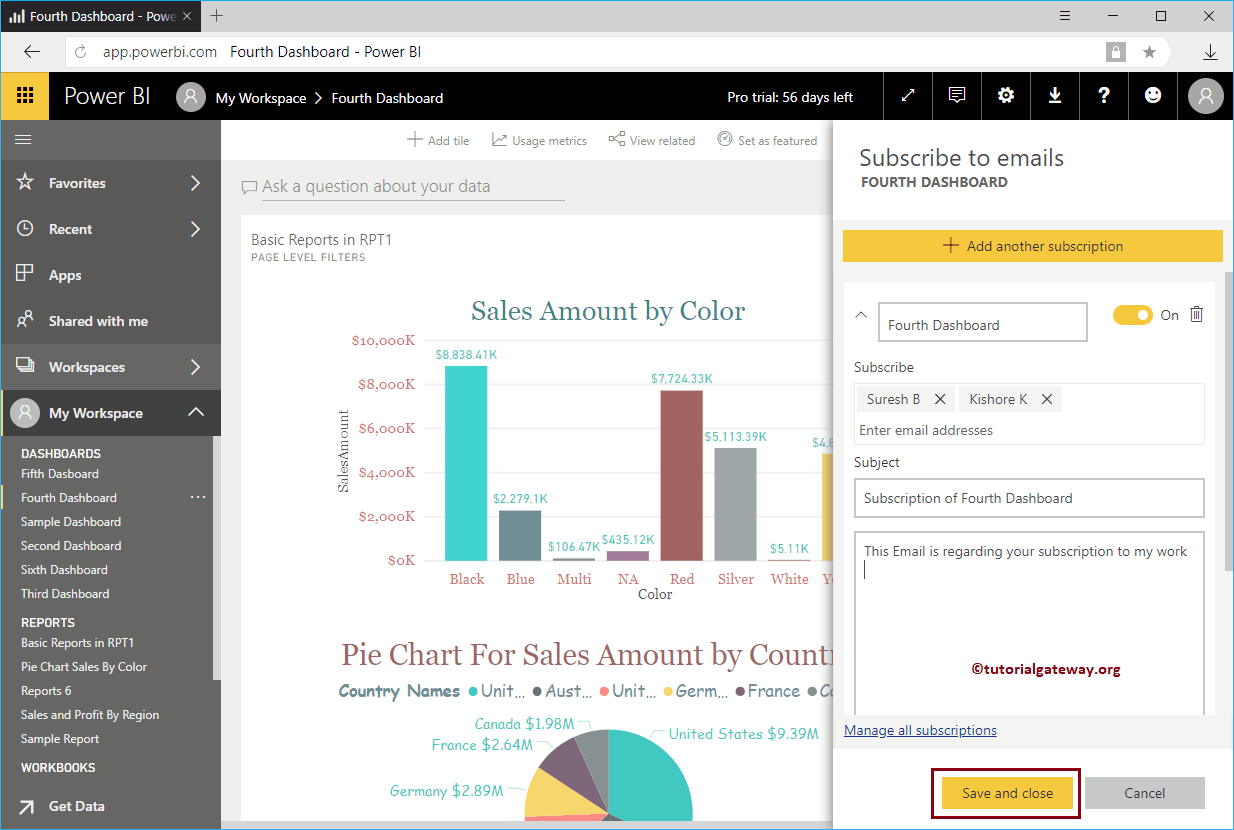
In this section, we show you the step-by-step approach of the Subscribe Power BI dashboard with a practical example. Before starting the subscription process for a panel of ...
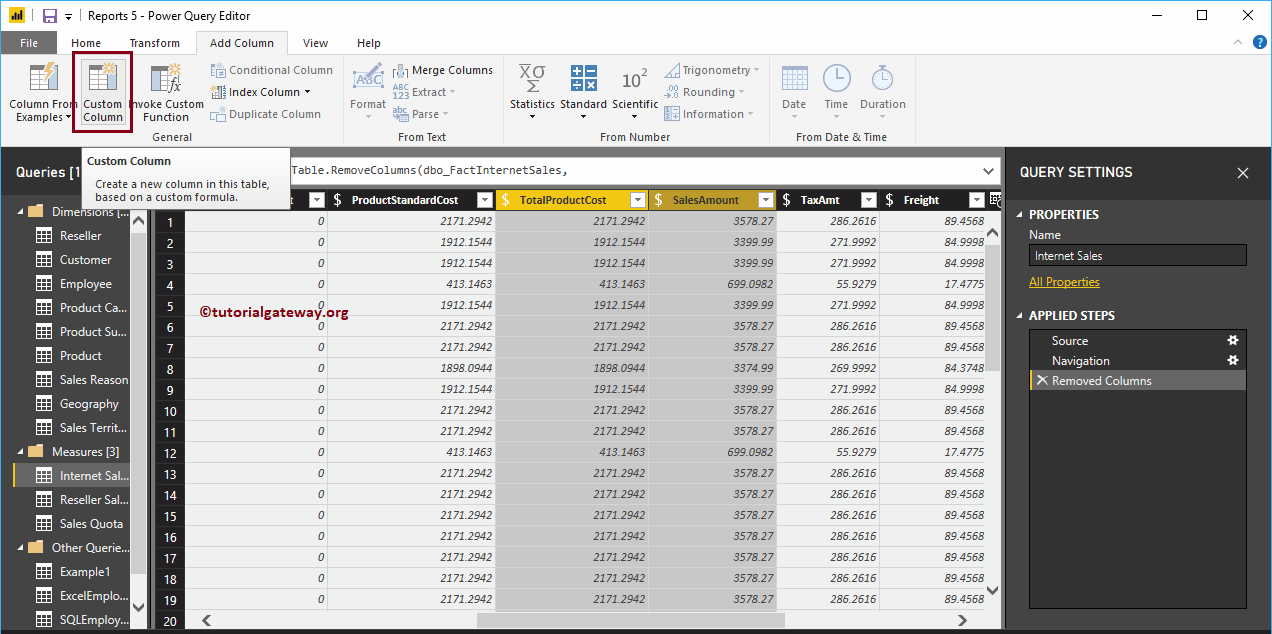
The Power BI custom column generates a new column based on the existing columns. For example, you can use this to calculate profit or loss, etc. Let's see how to create ...
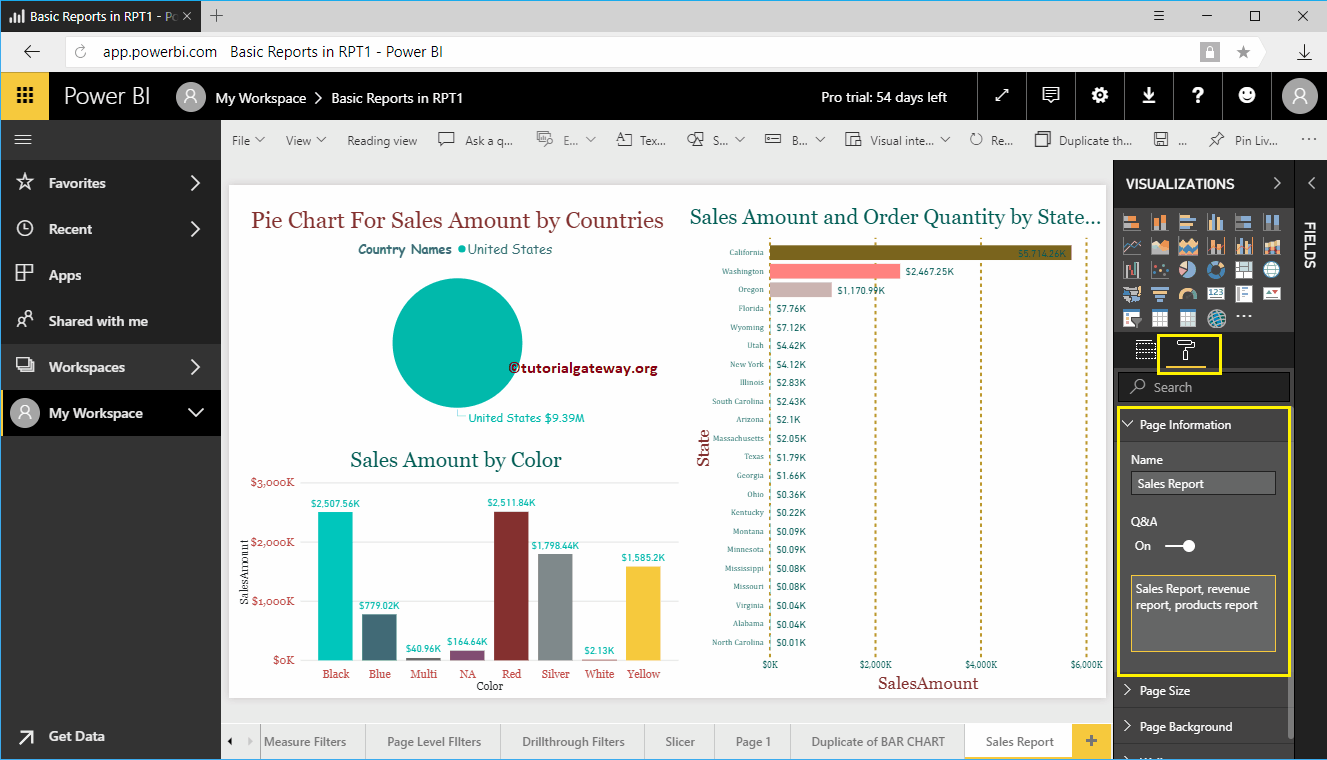
In Power BI, you can use the full report as a question and answer suggestion. I mean, you can display a full report with filters in the question suggestion list ...
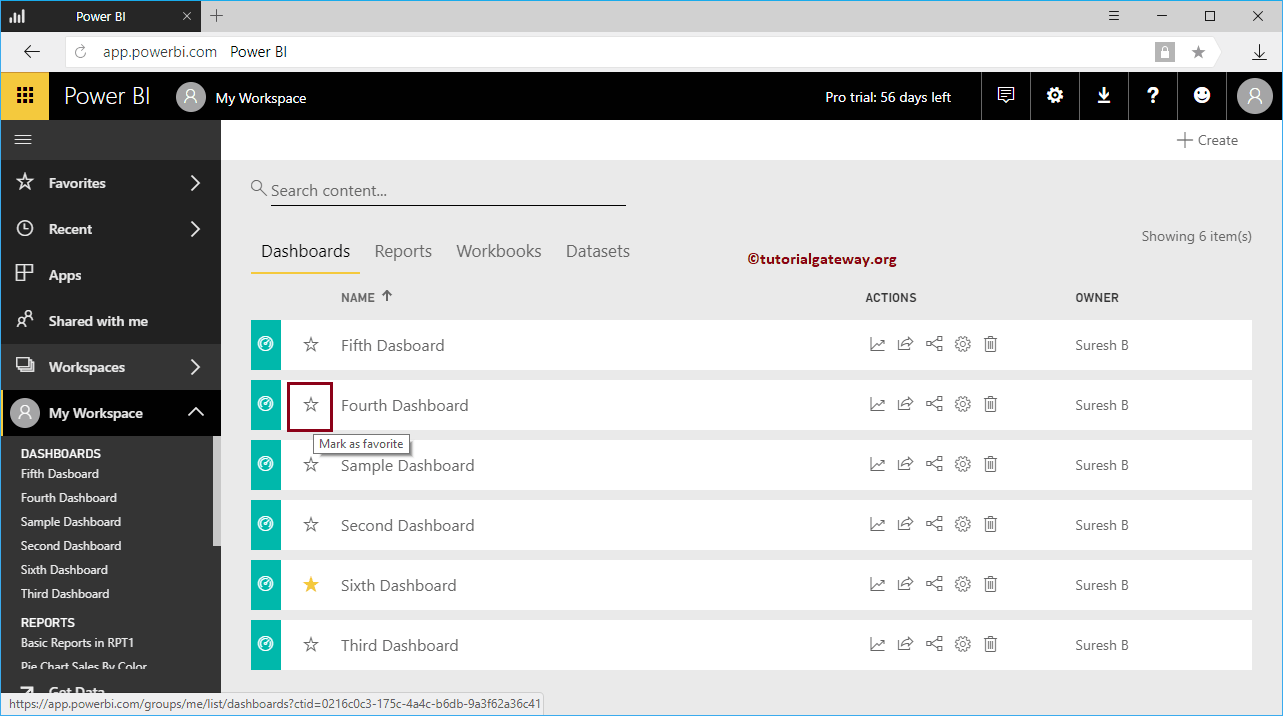
Power BI Favorites are the same as the Favorites of your Browser. If you find something (report, or a dashboard) interesting, then you can add them to Power BI favorites.…
How to use Power BI DAX math functions with examples? Microsoft Power BI DAX provides various mathematical or mathematical functions such as ROOF, FLOOR, CURRENCY, INT, SQRT, POWER, MOD, DIVIDE, ...
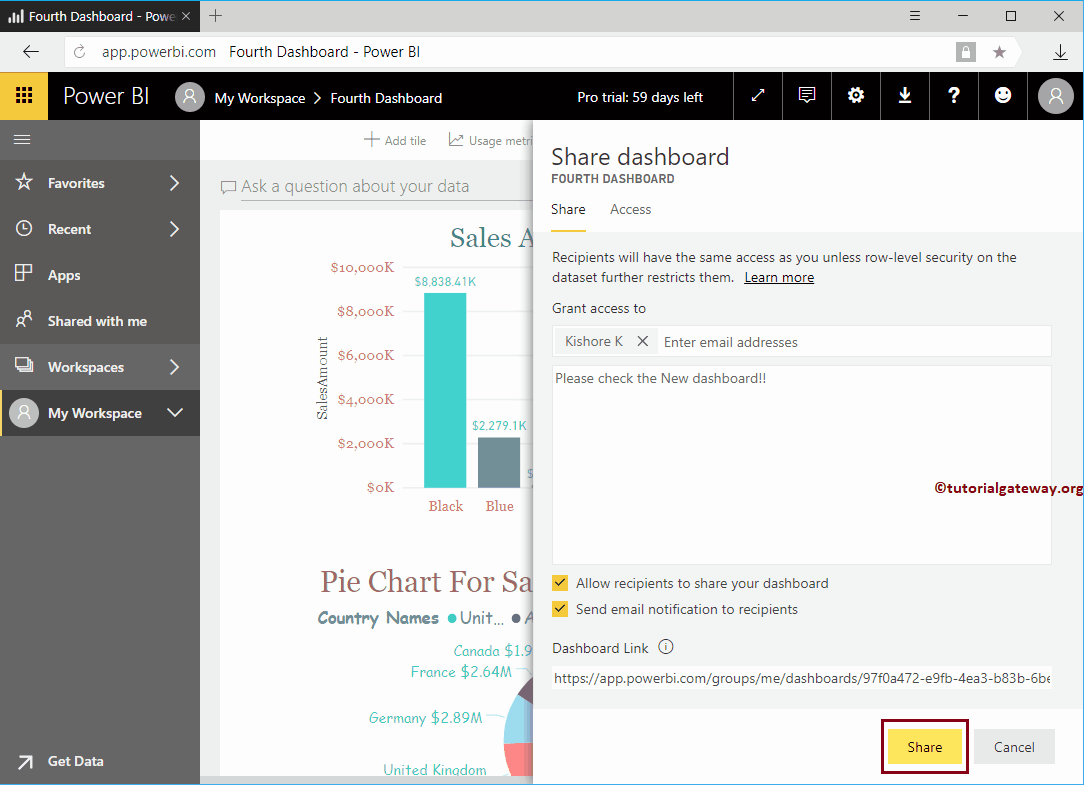
Let me show you the step-by-step approach to sharing the Power BI dashboard across your organization with a practical example. Before you start sharing your dashboard ...