
Let me show you how to create a table in Power BI with example. For this Power BI table report demo, we will use the SQL data source that we created in our previous article.
See the article Connect Power BI to SQL Server to understand the Power BI data source.
How to create a table in Power BI
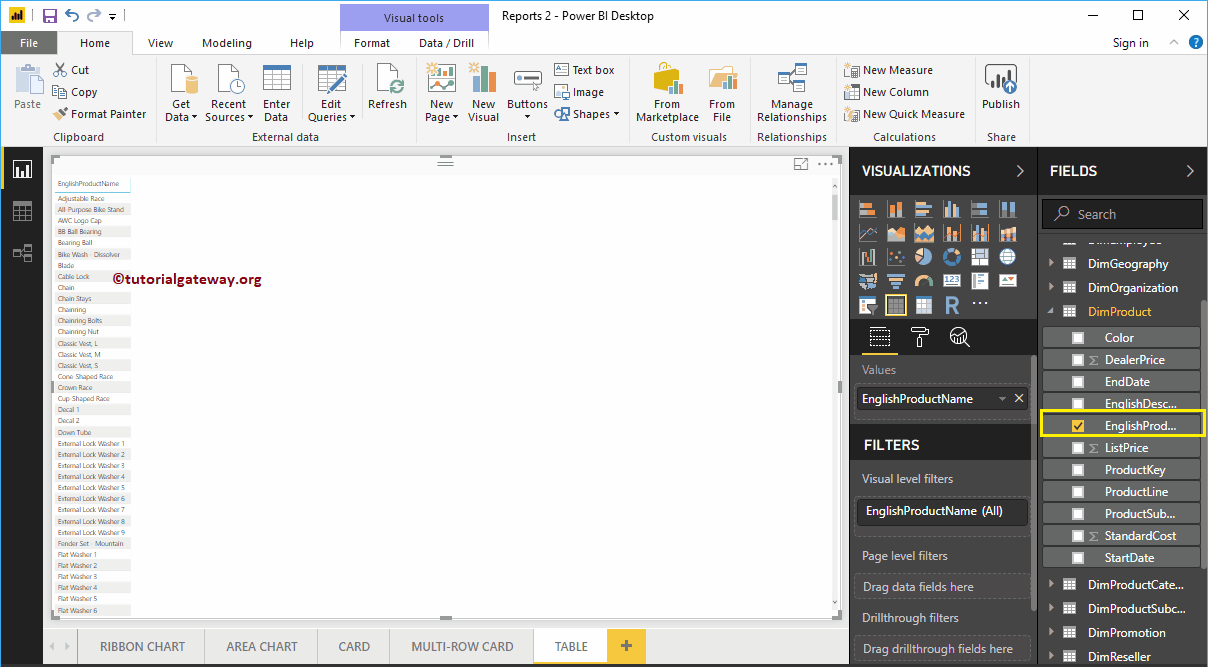
If you drag and drop any dimension field, Power BI automatically creates a table for you.
Let me drag and drop the English product name from the Fields section to the canvas, as you can see in the screenshot below, the desktop automatically creates a table for you.
 <>
<>Create a table 2 method
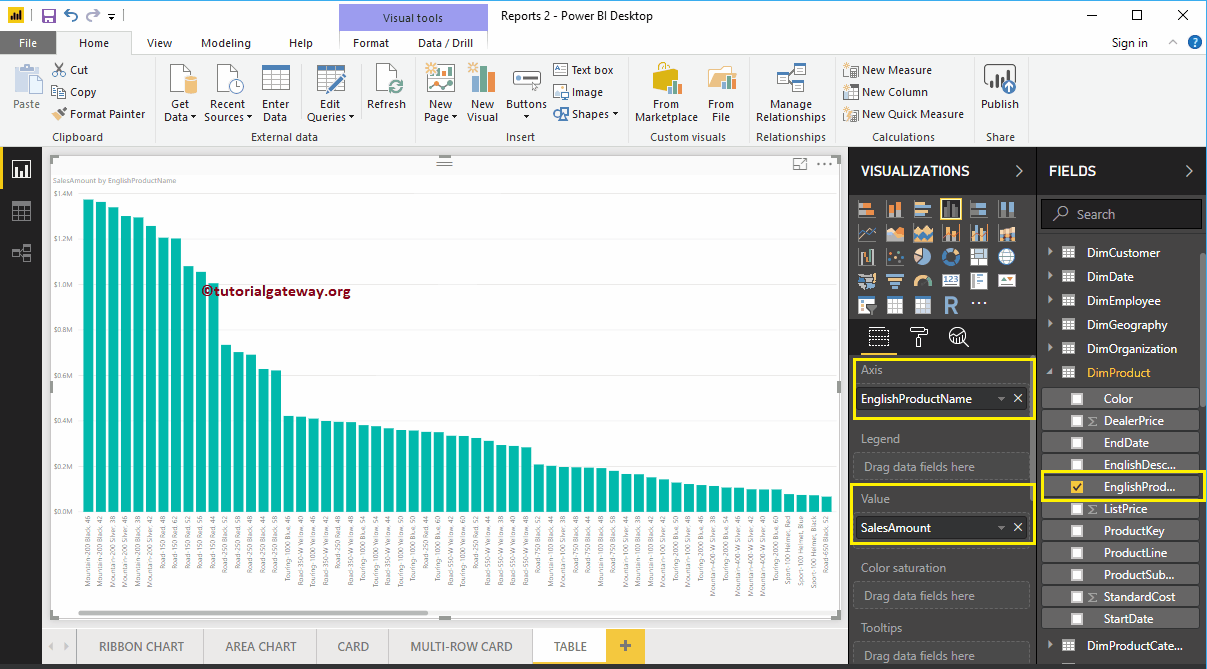
If you want to convert the existing chart to the table, you can follow this step. As you can see in the screenshot below, we created a column chart, which represents the sales amount by product name.
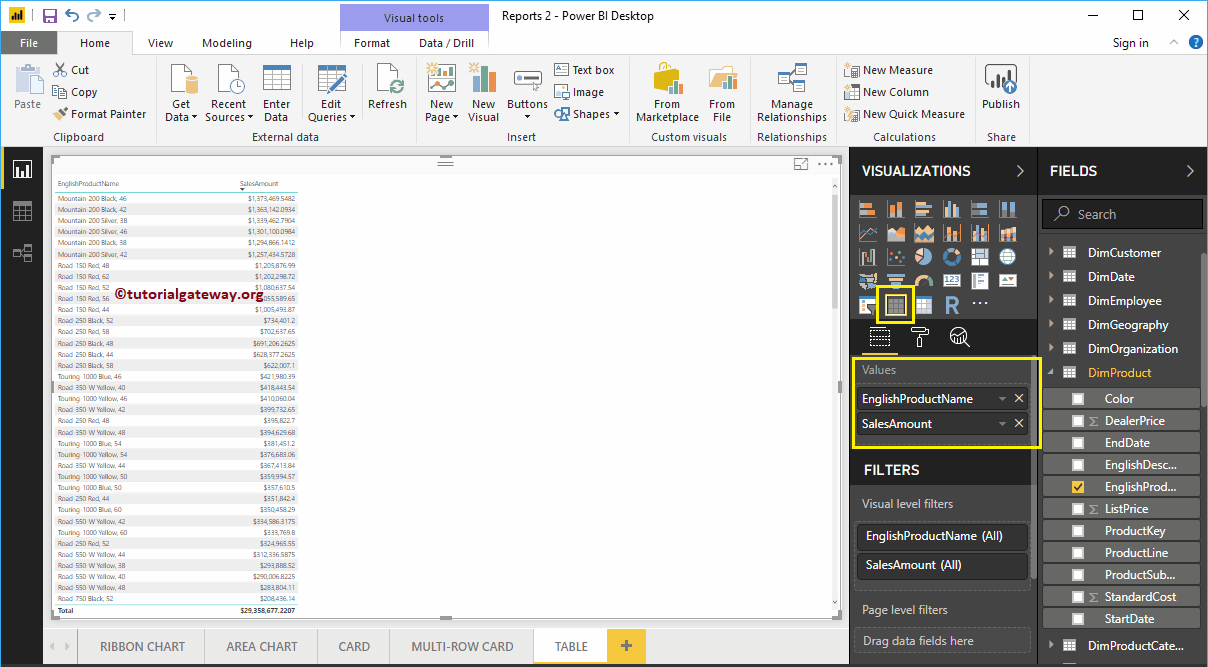
Click on the Table below Display section. Automatically converts the column chart to a table. In the following screenshot, you can see the tabular representation of the product names and their sales amount.
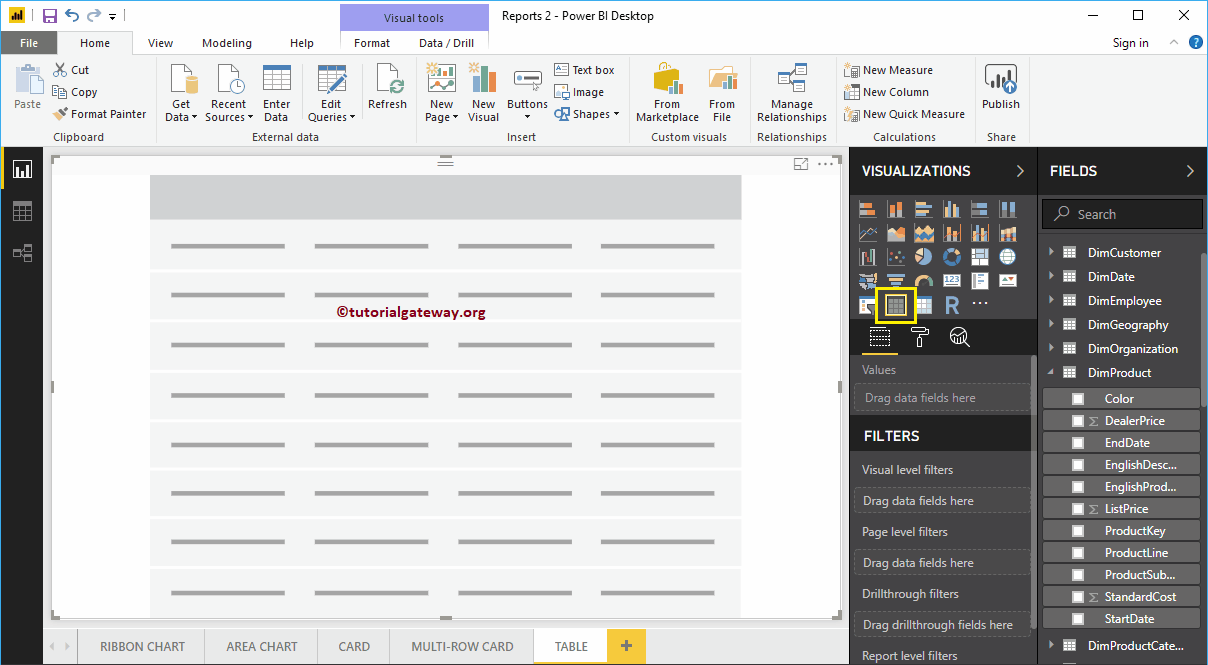
Create a table in Power BI approach 3
First, click on the Table present in the Display section. Automatically create a table with dummy data, as shown in the following screenshot.
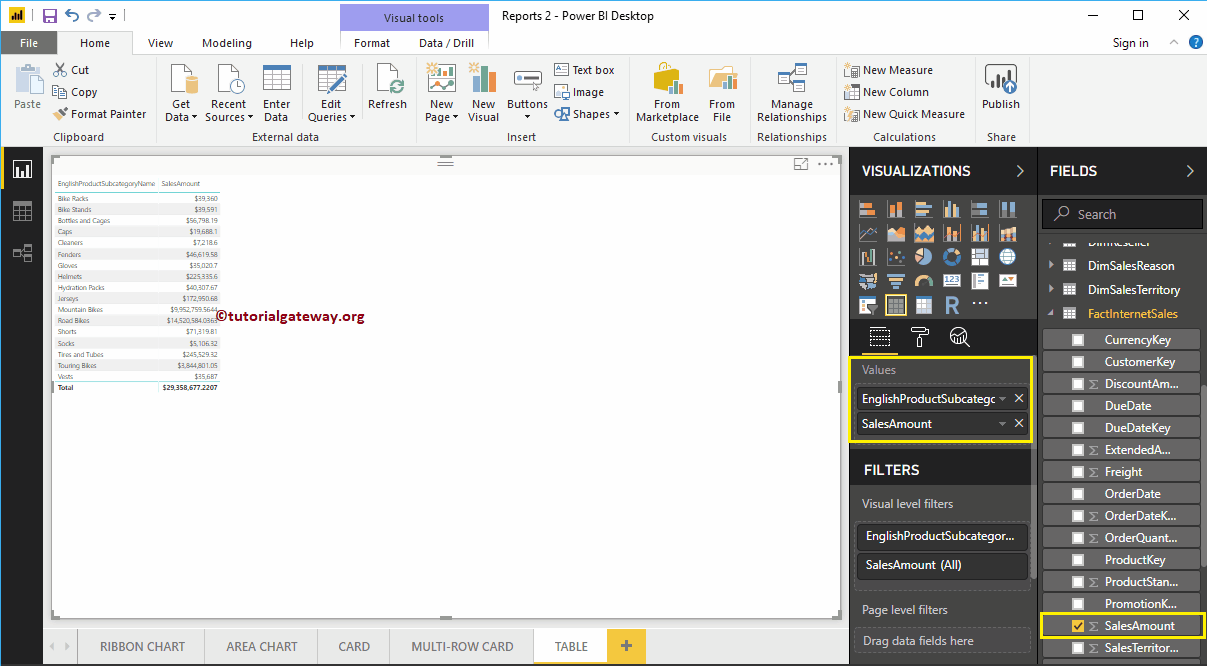
Next, let me drag the subcategory names and product sales amount in English to the Values section. Now you can see the table.
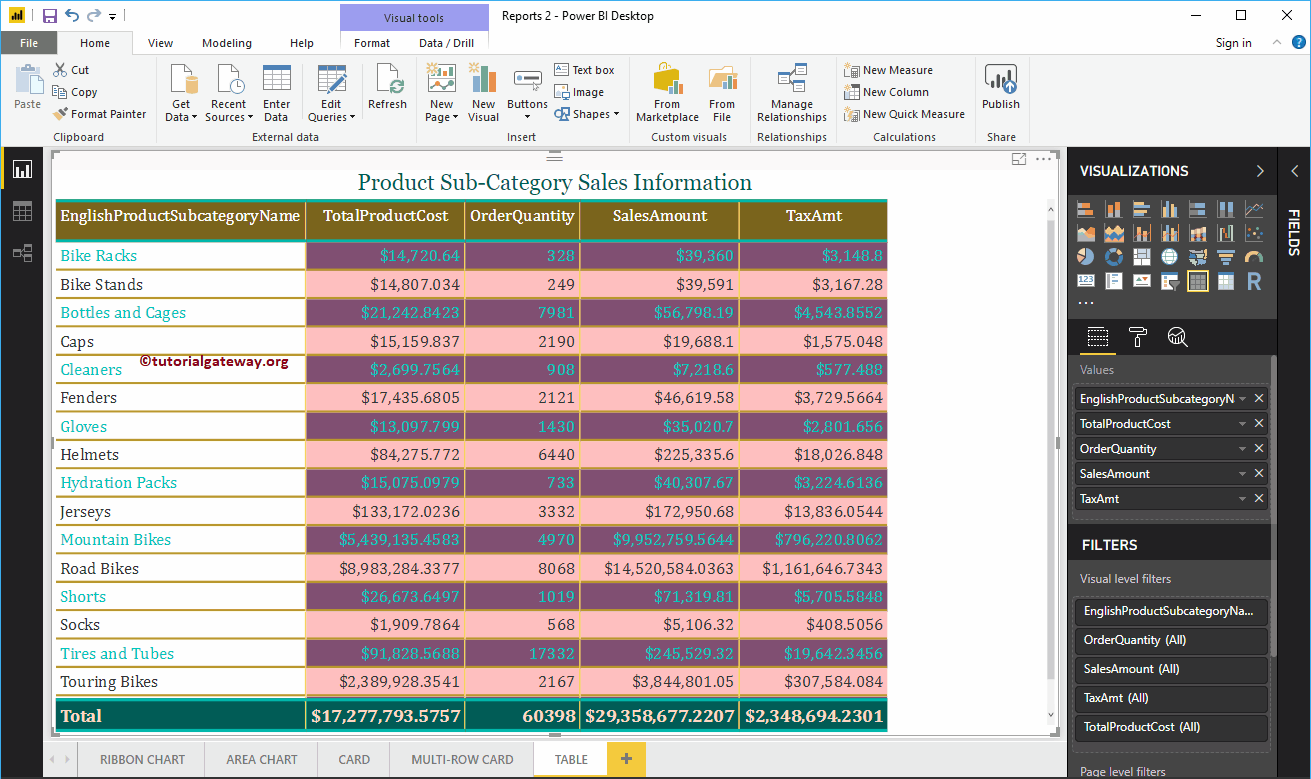
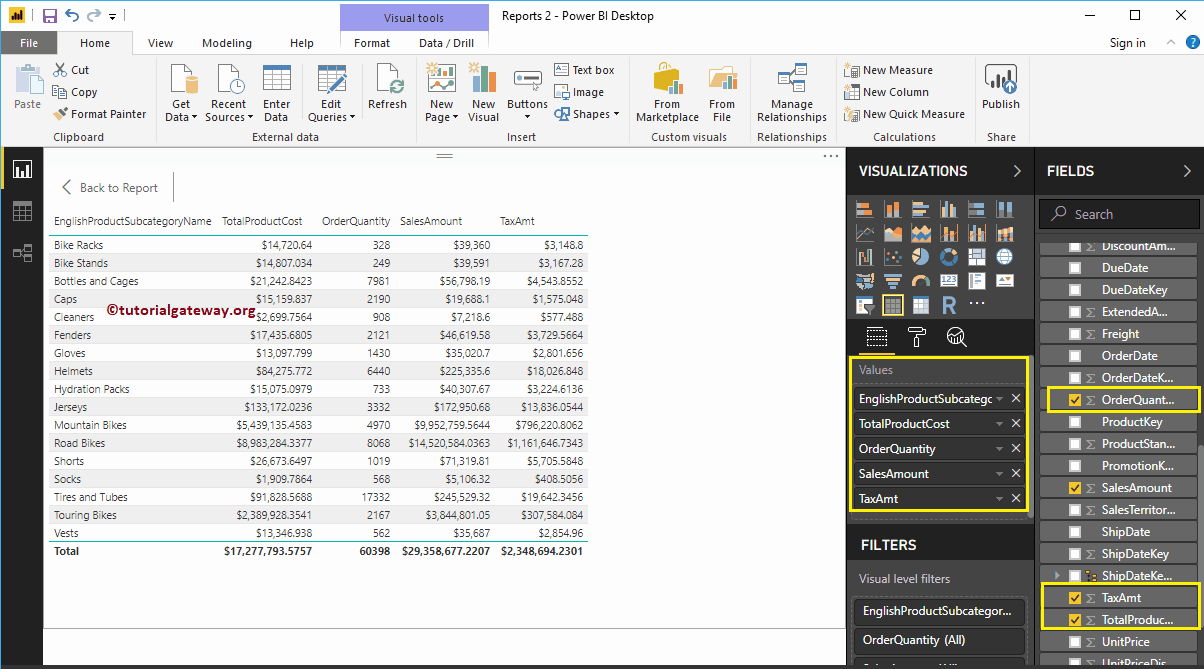
Let me add a few more metric values such as total product cost, order quantity, and tax amount
Let me quick format this table.
NOTE: I suggest you refer to the article Formatting a table to understand the formatting options.


