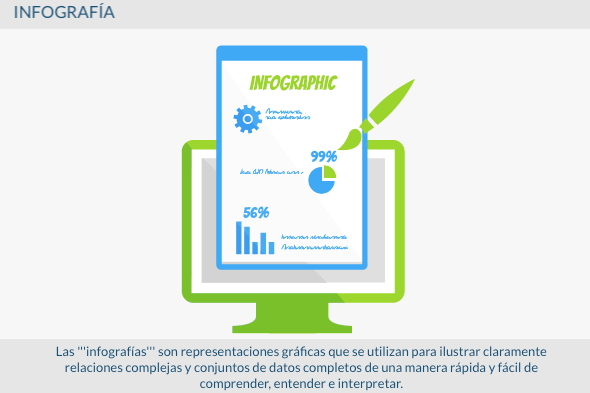
The infographics are graphical representations used to clearly illustrate complex relationships and complete data sets in a way that is quick and easy to understand, understand, and interpret.
Requirements for an infographic
The most important requirement of an infographic is that the interrelationships between the different aspects are illustrated correctly. In this case, it is essential to ensure that the data used is investigated correctly and that the interrelationships are correct. The reader should be drawn to the chart and guided through it automatically.
A good infographic is self-explanatory and doesn't require an additional description in text form. In this way, it can be shared online without restrictions and integrated into a new context without giving up its importance.
Apps
Infographics are used to graphically illustrate different alternatives for data material. These include:
- chronological correlations
- comparisons
- family trees
- business organization
- instructions and procedures
- statistical data
- organization charts
- weighting of advantages and disadvantages or opportunities and risks
- spatial interrelationships and local circumstances
Advantages and disadvantages
The main reason infographics are used is because they help make complex data sets understandable in a very short time. Primarily for online use, they are useful when you want to quickly provide users with the information they are looking for. Other advantages of infographics include:
- decompose complex data sets into smaller pieces of information
- better understanding
- easier to remember thanks to the combination of images and text
- infographic is shared many times on social media
- various apps (for example, on websites, press releases, brochures, etc.)
One downside of infographics is the large amount of time required to prepare it. The design alone is very complicated, and then there is the actual graphic work. Another problem is that infographics are often presented as something without text. This is because Google cannot read the text contained in the graphics. At the same time, adding clickable links is not easy. Another thing that is often problematic is the fact that most apps only work with up-to-date data. As a result, the data quickly becomes out of date and must be replaced with new material. This means that infographics only remain interesting for a comparatively short period of time, despite the high costs.
Creation of infographics
Before an infographic can be created, the necessary facts and data must be researched, chosen, categorized, and structured. The next step involves the development of an appropriate concept and the construction of a story in which the data must be incorporated. Only then does the real work, the design, take place.
Graphics software
You need proper graphics software to create an infographic. For those of you who are not that familiar with web design, there are currently several free or paid web features that make creating infographics simple.
- Infogr.am (creation via drag and drop)
- PiktoChart (customization of colors, fonts and graphic items of different themes)
- Wordle (word cloud creation, equivalent to tag clouds)
Importance for online marketing
Since good infographics are shared more frequently online, they can be a good source of traffic and links. At the same time, they can also be used to boost SEO. For this reason, infographics are an integral part of the online marketing mix for many site operators.
Despite everything, infographics are increasingly being created for purely commercial purposes and often fall short of their actual demand. This is why Matt Cutts explained in an interview that, in the future, it would be conceivable to have links that result from undervalued infographics. Cutts criticized that many infographics are often poorly researched, are riddled with errors and often confuse the reader.