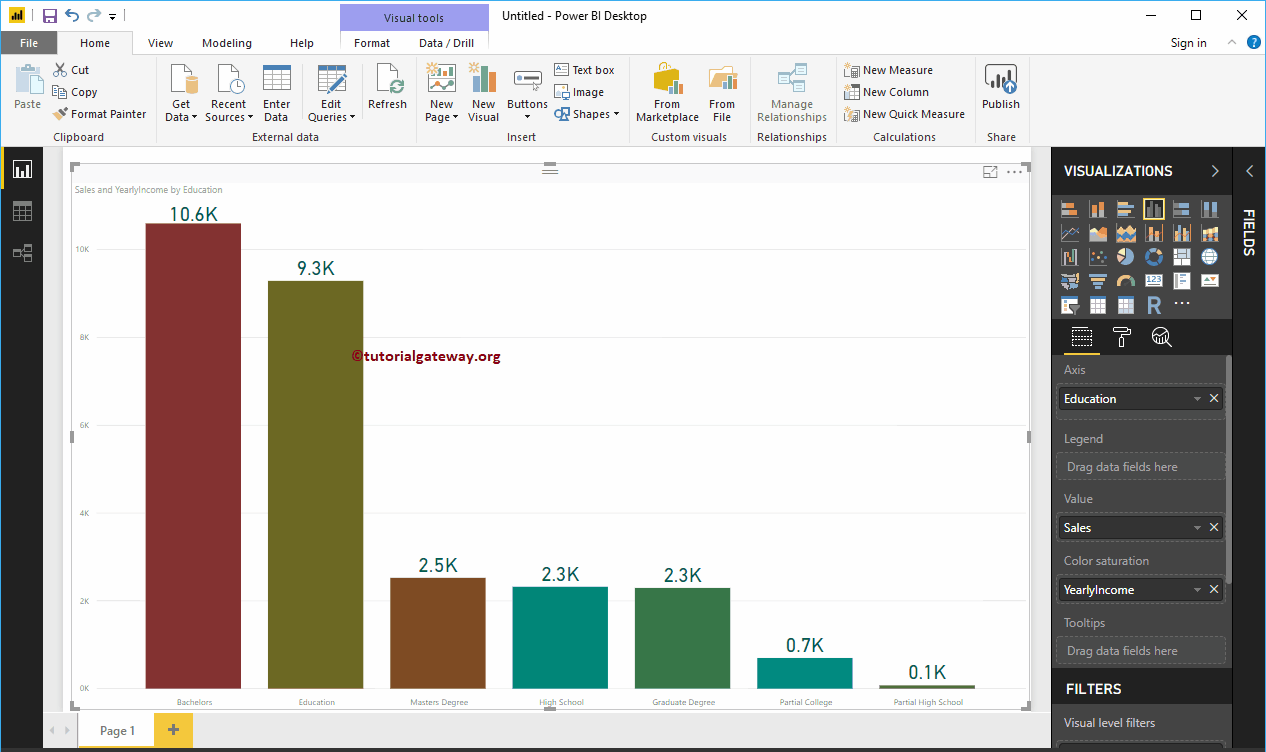
In this study, we show you how to connect Power BI to text files and how to get data from a text file to Power BI. To demonstrate getting data from a text file to Power BI, we will upload data from a text file to Power BI and generate a column chart.
How to get data from a text file to Power BI
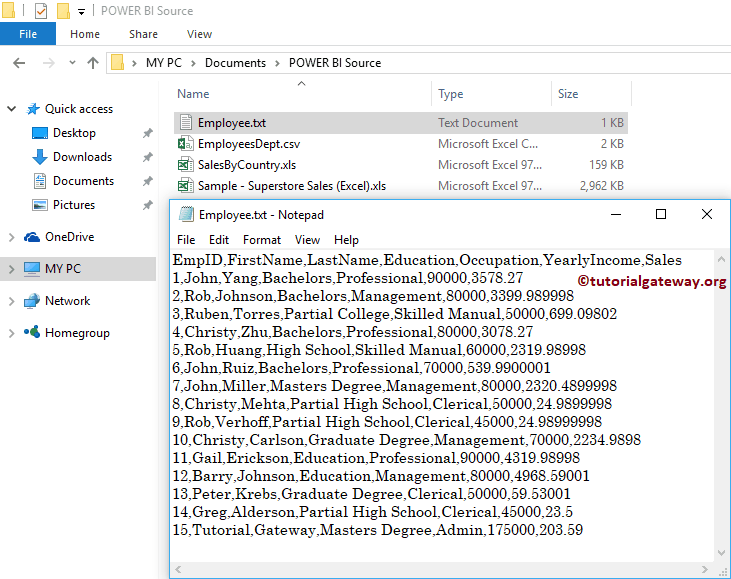
Before we start getting data from a text file to Power BI, let's look at the data present in the employee's text file. In the following screenshot, you can see that it is just a normal text file. If you look closely, the First row has the column names
 <>
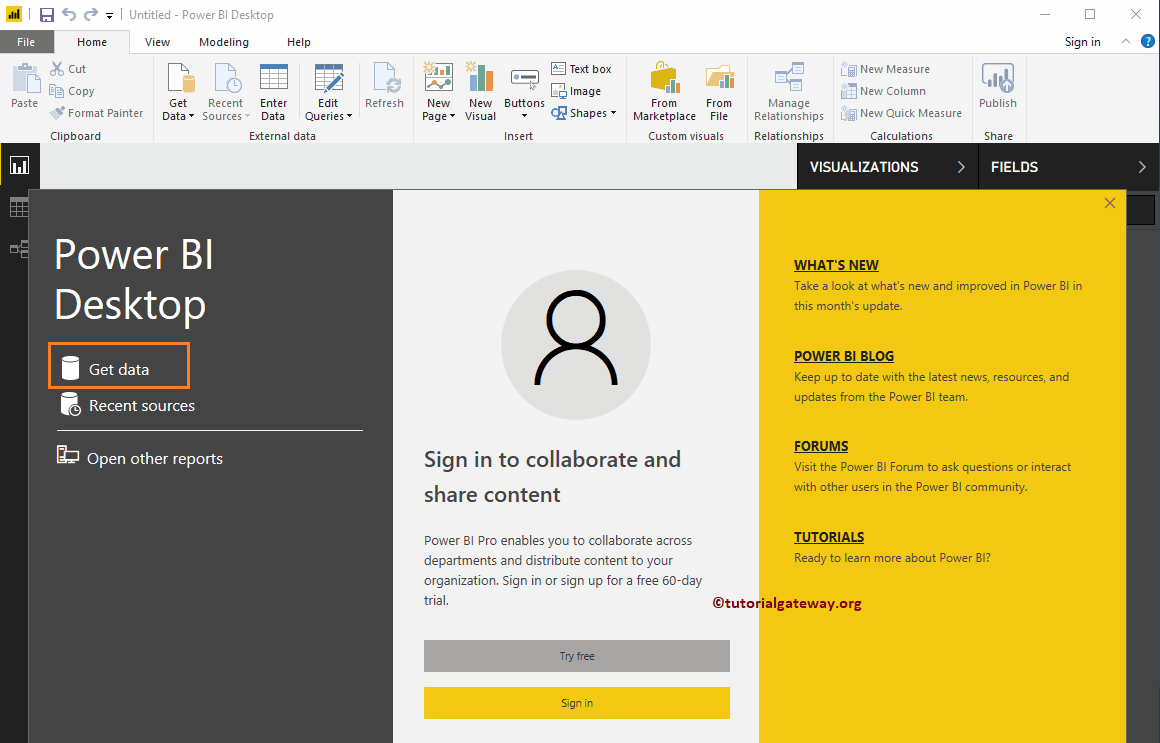
<>If you haven't started Power BI Desktop yet, double-click Power BI Desktop to open it. Once it's open, it looks like the screenshot below. Click on the Get information Hyperlink
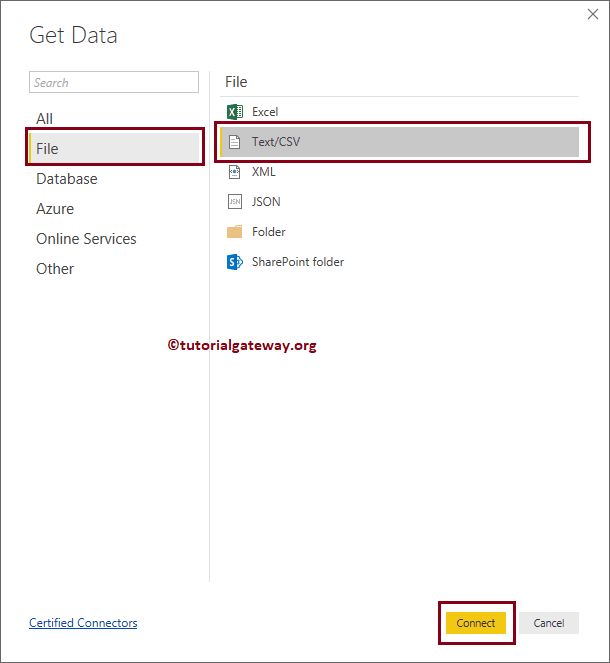
If you are on the Power BI visualization page, on the Home tab, click the Get information option and select the Text / CSV, as we show below. Or select More options.
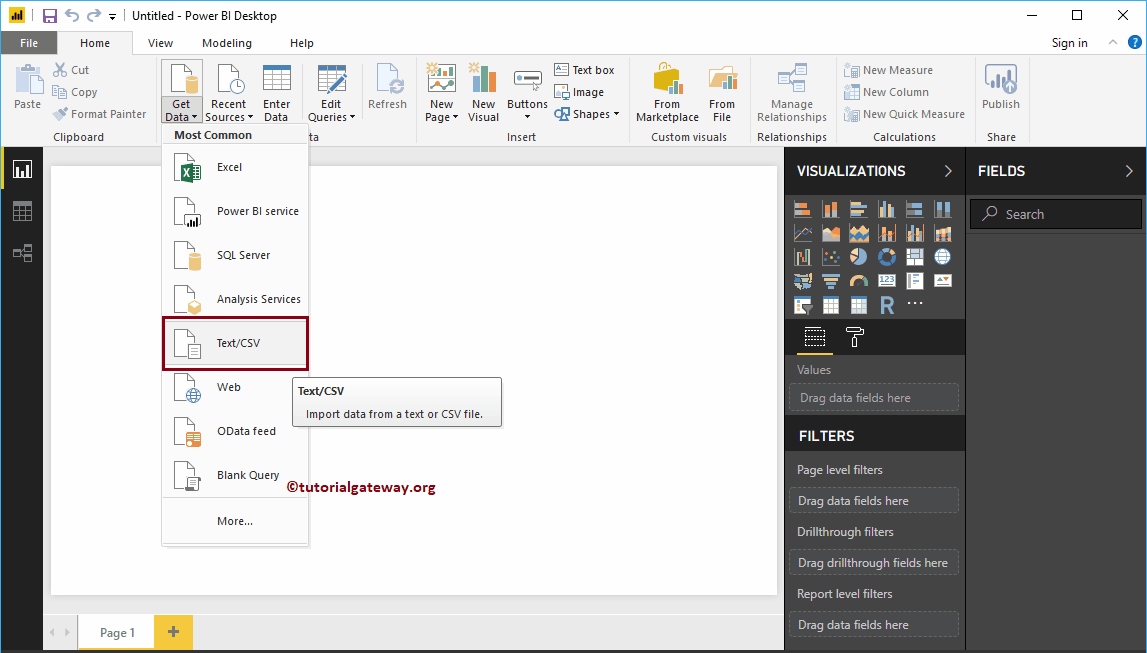
Get data from a text file to Power BI
When you select the More option, the following window will be displayed. You can use this window to select the data source you want. For now, let me select the Text / CSV Option and click Connect button

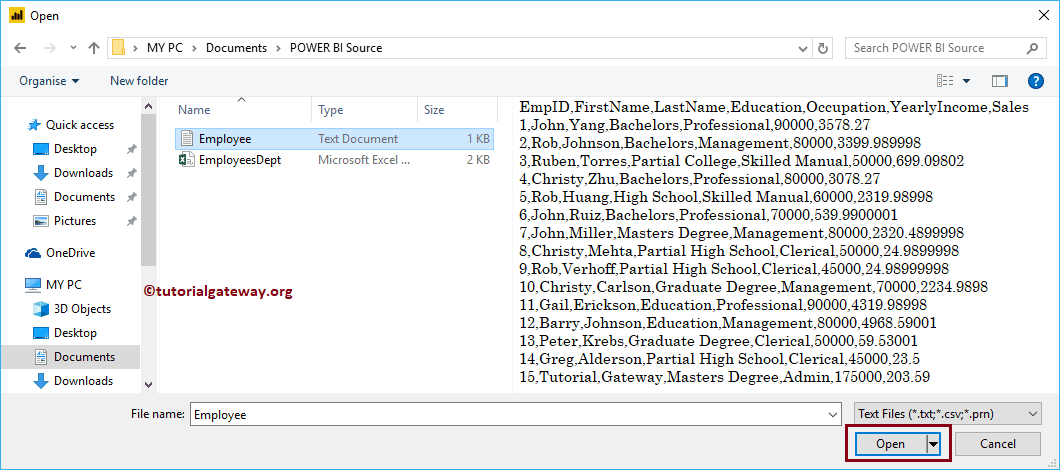
Once you click on the Connect , a new window opened to select the text file from our file system. For now, we are selecting the Employee.txt file, as shown below.
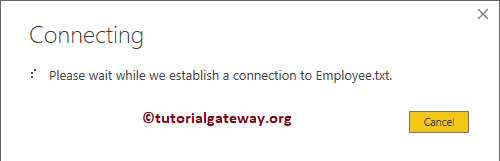
Wait until the connection is established
Now you can see the preview of the data present in the text file.
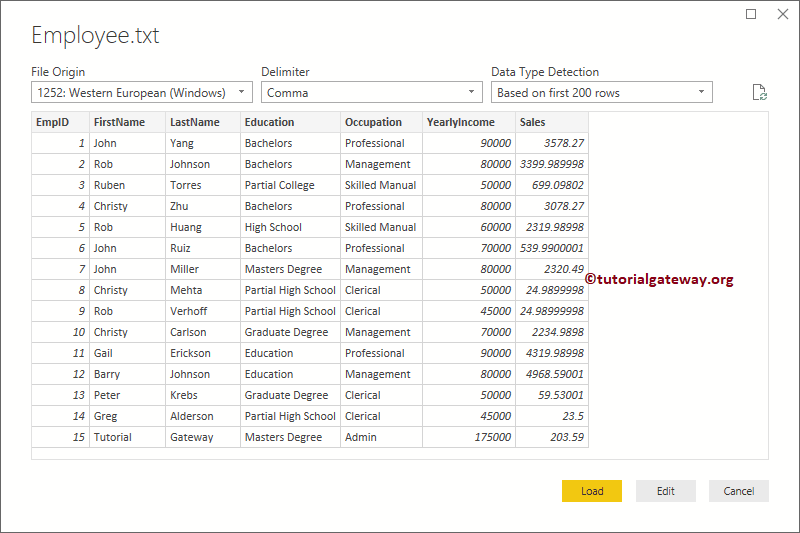
Most of the time, Power BI automatically selects the delimiter and separates the columns. If this is not the case, use the Delimiter option to change according to your requirements.
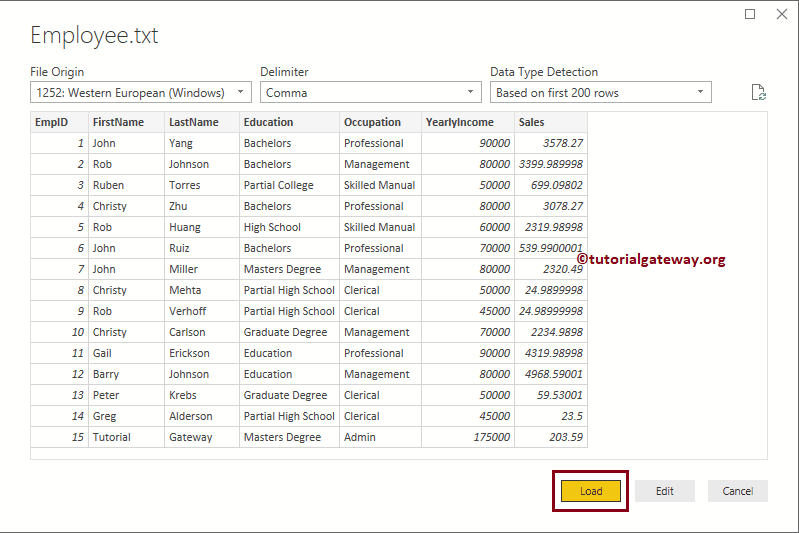
If you are satisfied with the data and data types, click the Upload button; otherwise, click the Edit button to make changes.
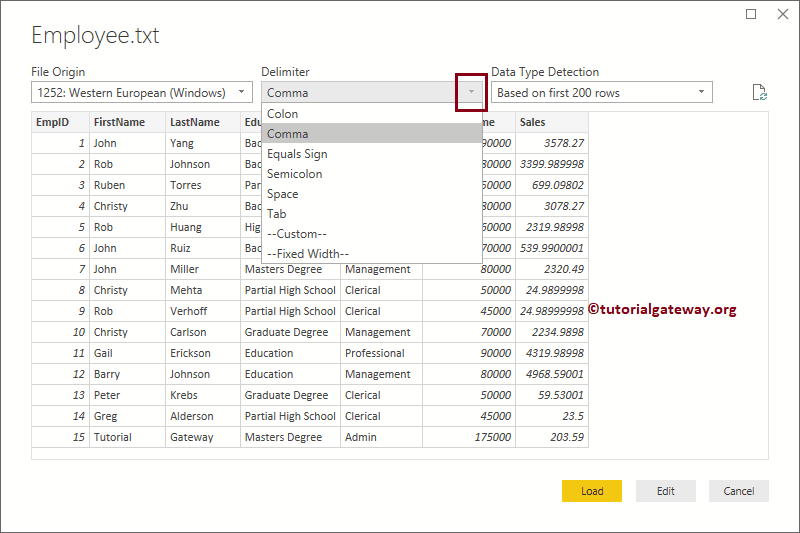
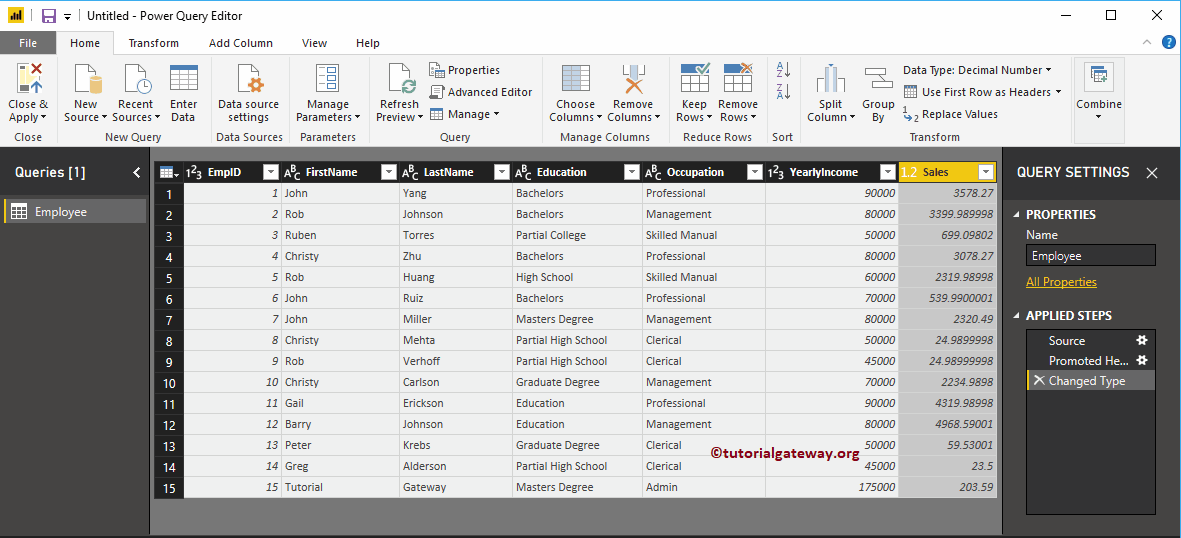
Clicking the Edit button opens the following window. Use this window to change the data according to your needs.
Currently, we do not want to make any changes to the data. So let me click on the Load button
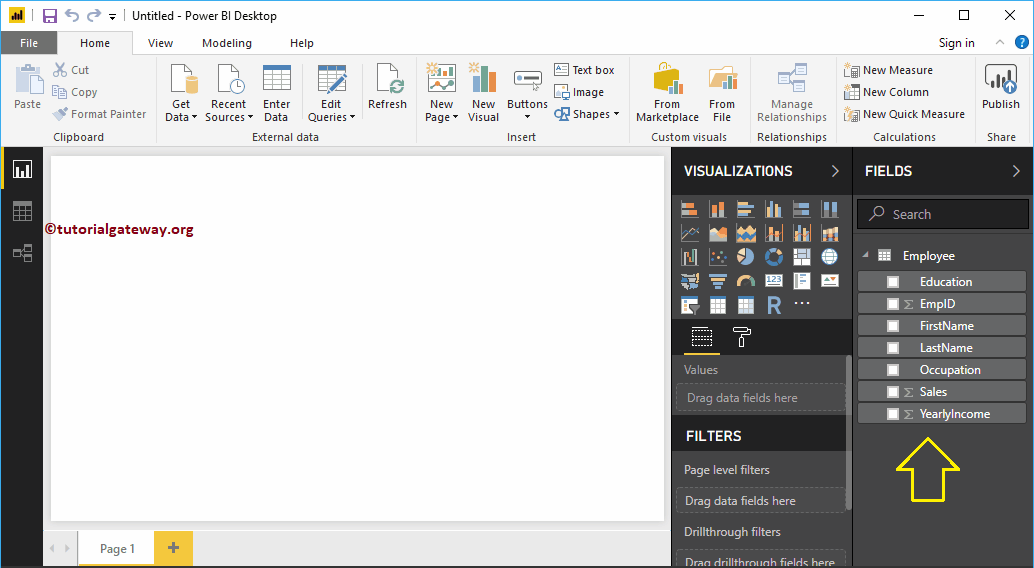
Now you can see all the imported columns from the text file below the Fields section.
Let me create a column chart with this data. I suggest you check out the Column Chart in Power BI article to understand the steps required to create it.