How to create page level filters in Power BI with an example? Power BI page-level filters are useful for filtering the charts (or visuals) present on the page. For example, if your page contains four charts, you can use this page-level filter to filter those four reports at once.
How to create Power BI page level filters
To demonstrate page-level filters in Power BI, we'll use the column chart, pie chart, and bar charts that we created in our previous Power BI post.
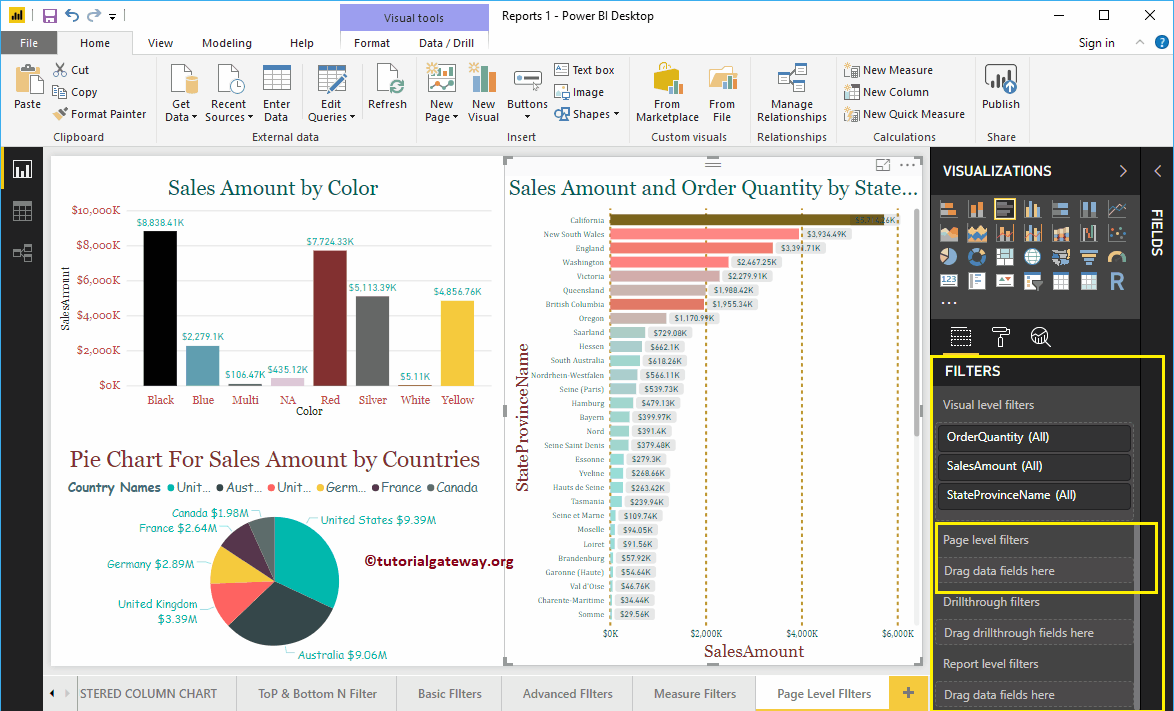
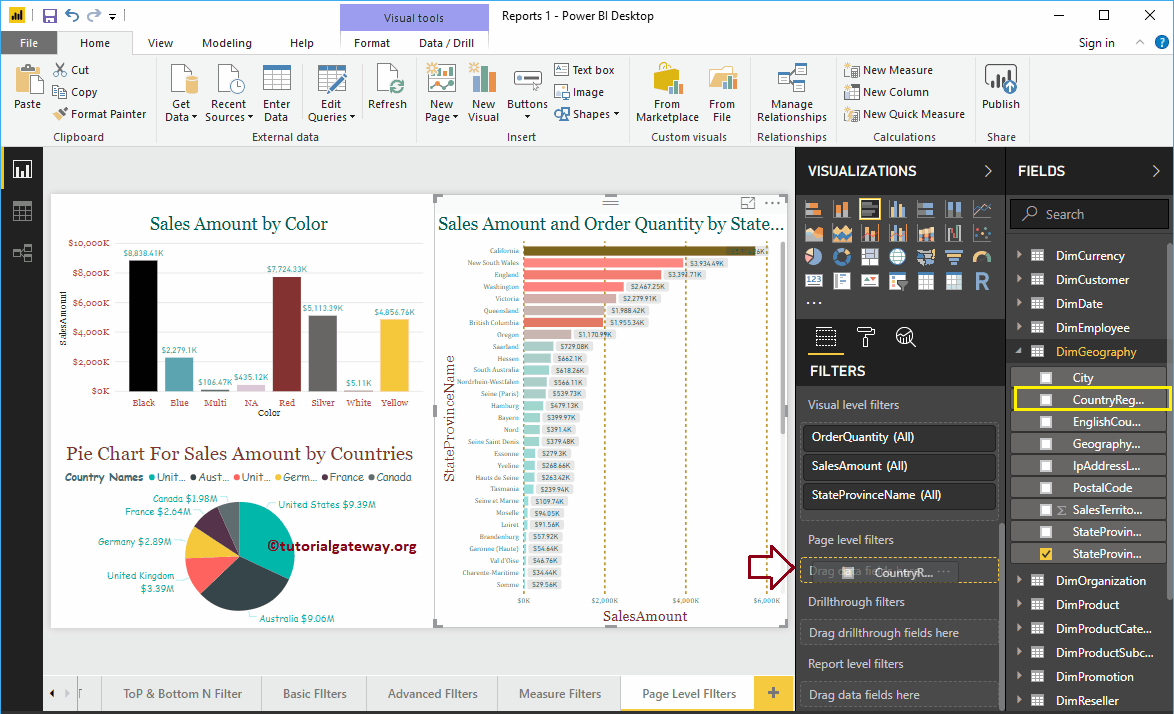
In the Filters section, you can see the list of page-level filters available in Power BI. You have to use the Page level filters section to create a page-level filter.
Let me drag and drop the English country region name from the fields section to the page level filters.
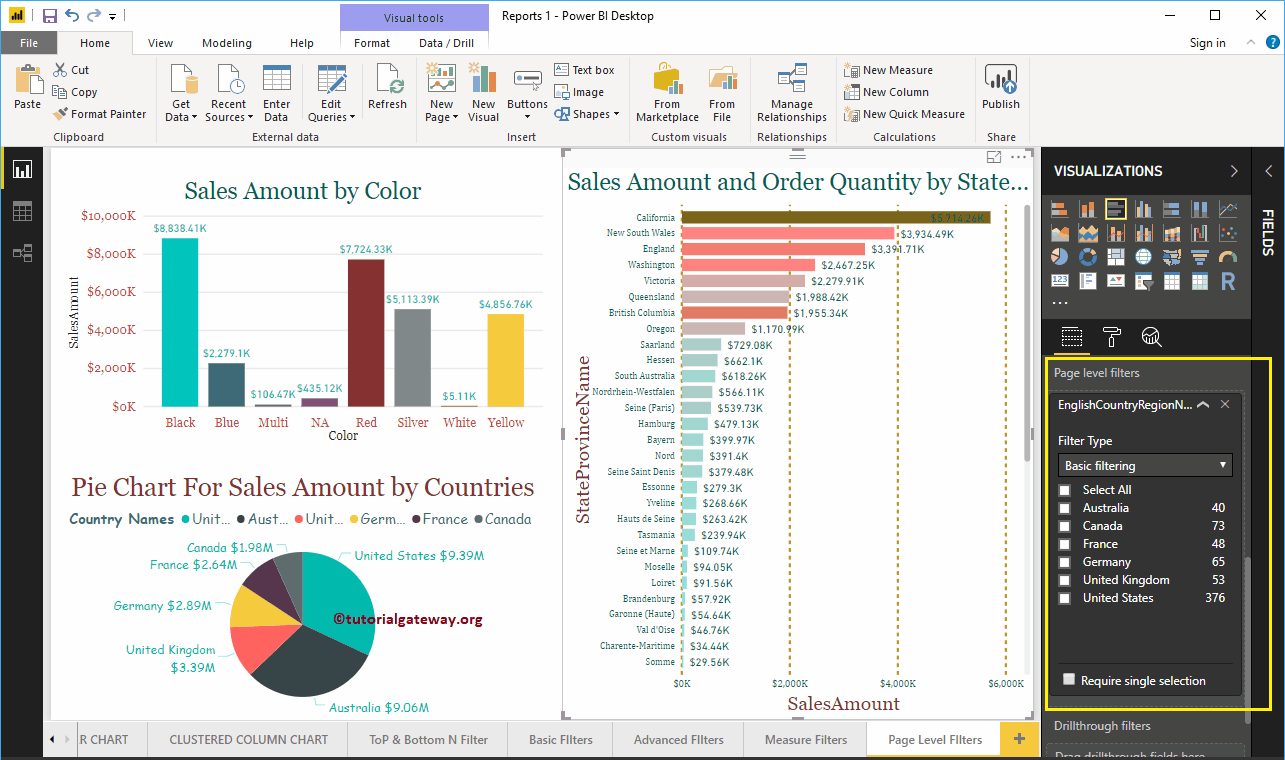
Expand the name of the country region in English to see the filter types. By default, the Basic Filters option selected as the Filter Type.
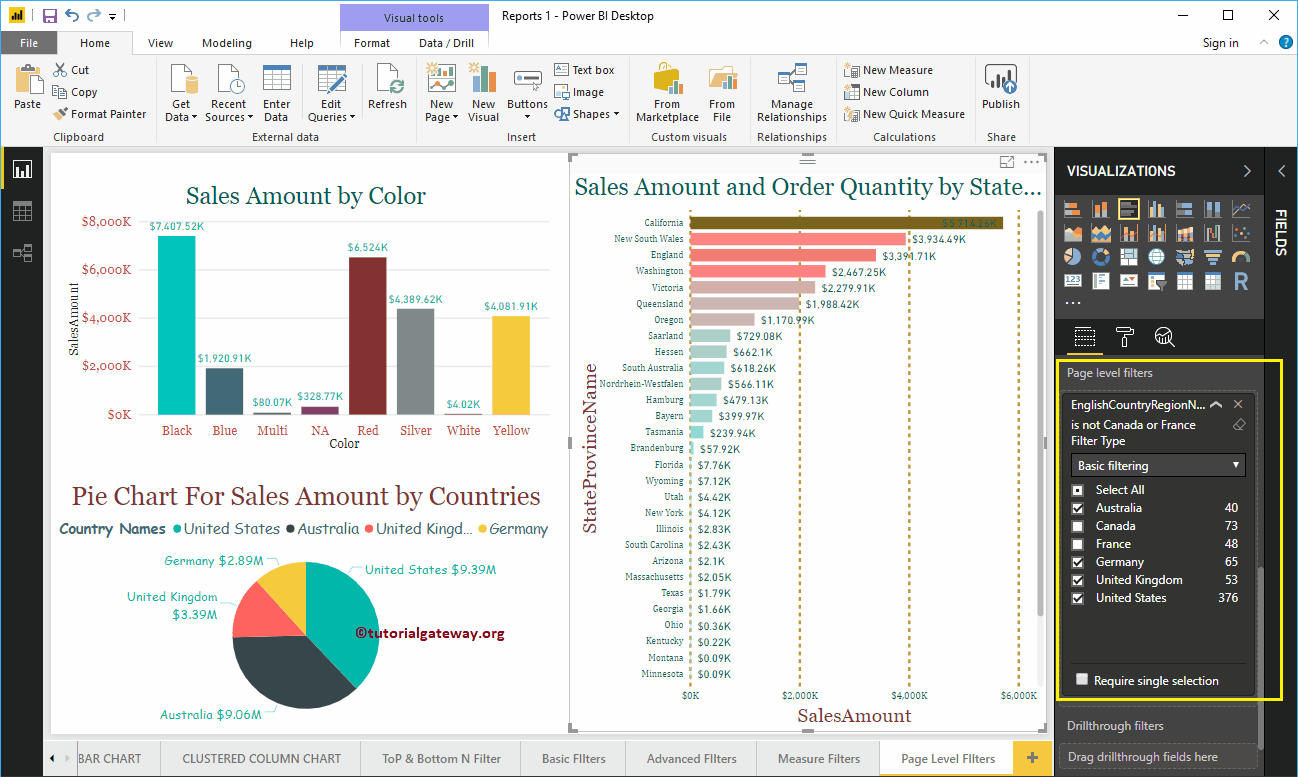
For the purpose of demonstration, let me select Australia, Germany, the United Kingdom, and the United States. In the following screenshot, you can see that the column chart shows the sales for the selected countries. The pie chart shows the selected countries. And, the bar chart shows the states that belong to these countries.
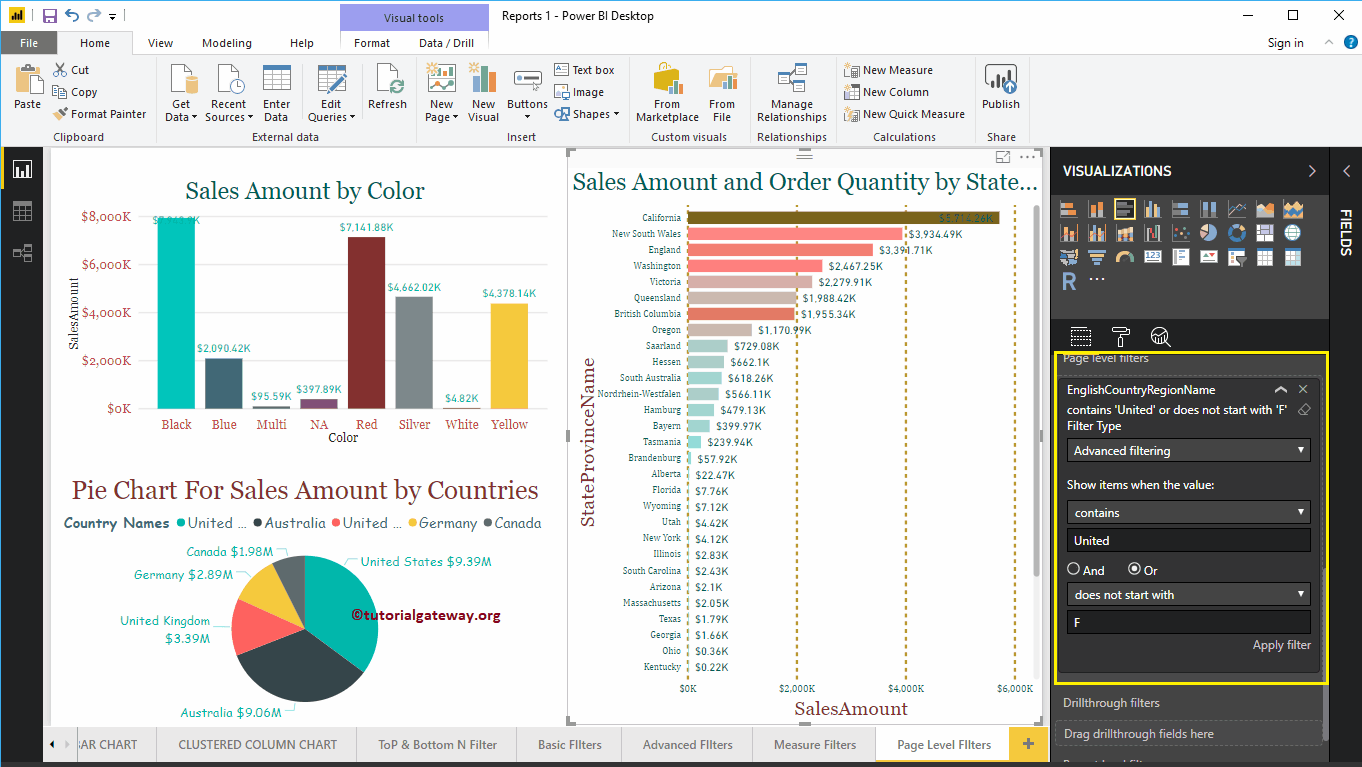
Use the drop-down menu to change the filtering type to Advanced filter.
Here, we are applying various filters on the Country column. The first filter checks whether the country contains a unified keyword or not. Or, the second condition checks for countries that do not start with F.
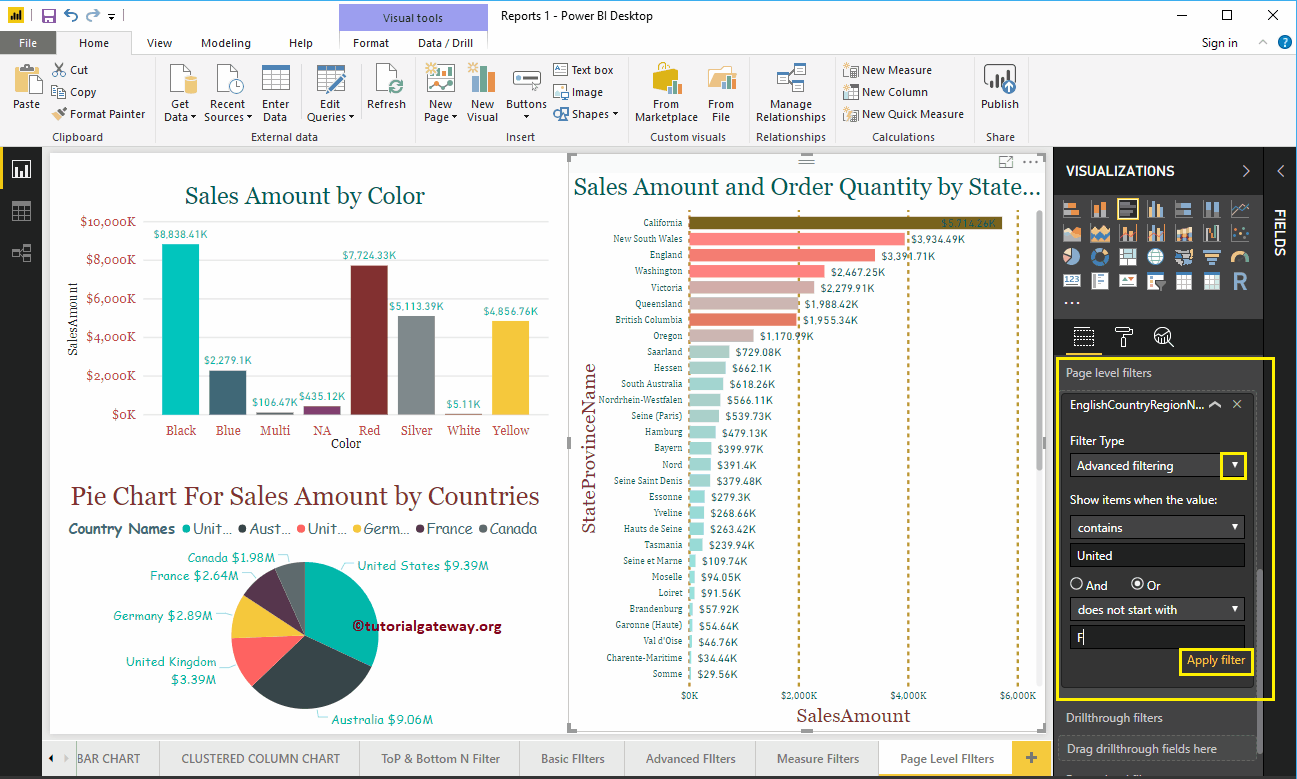
The next page shows the countries that contain the United keyword, and the countries do not start with F.

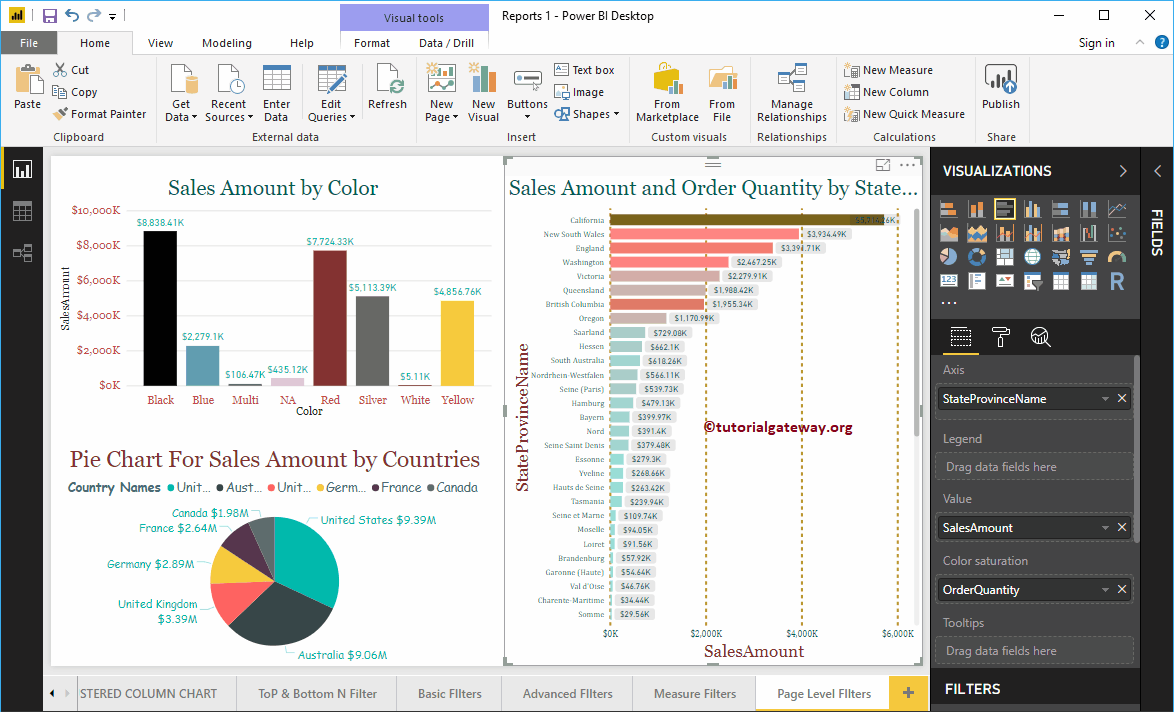
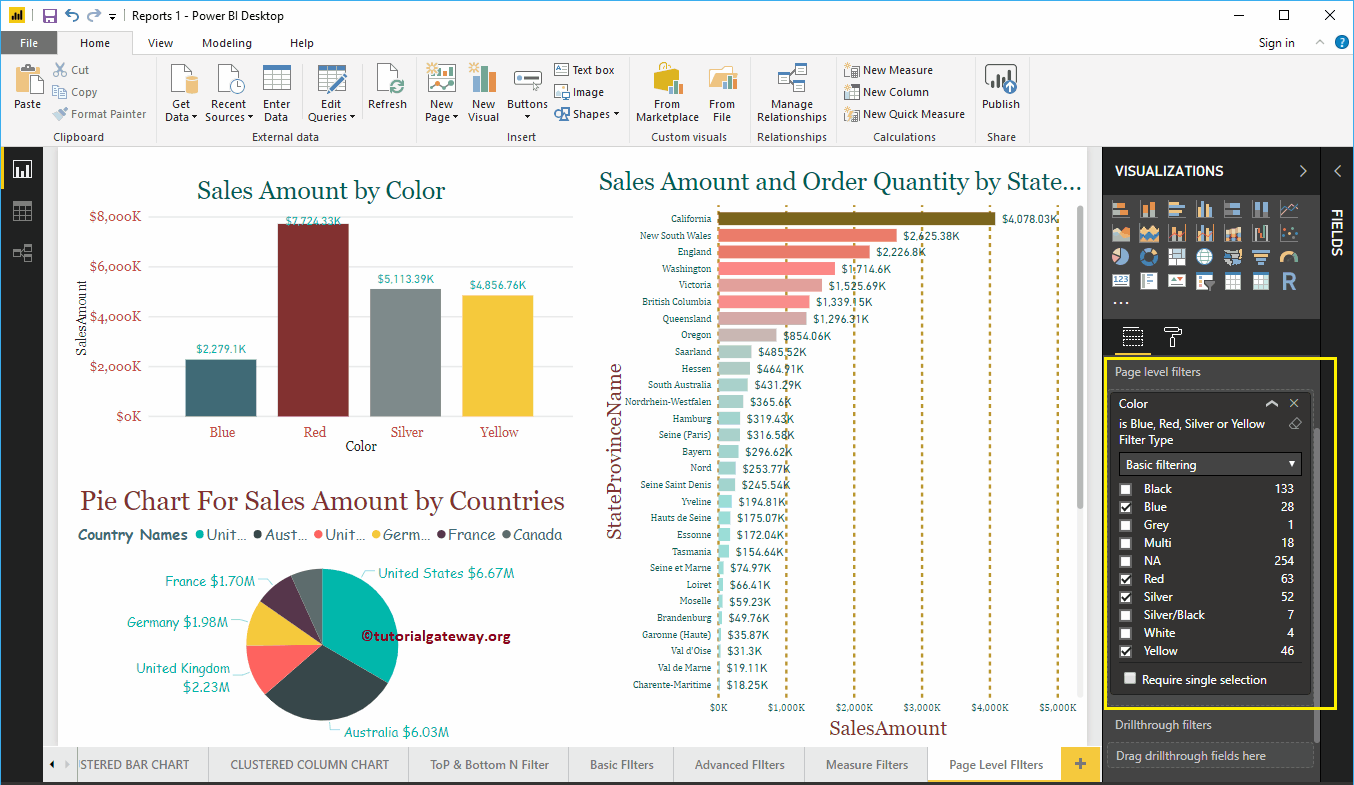
Let me remove the existing page level filters in Power BI and drag and drop the Product Color section of the fields onto the page level filters.
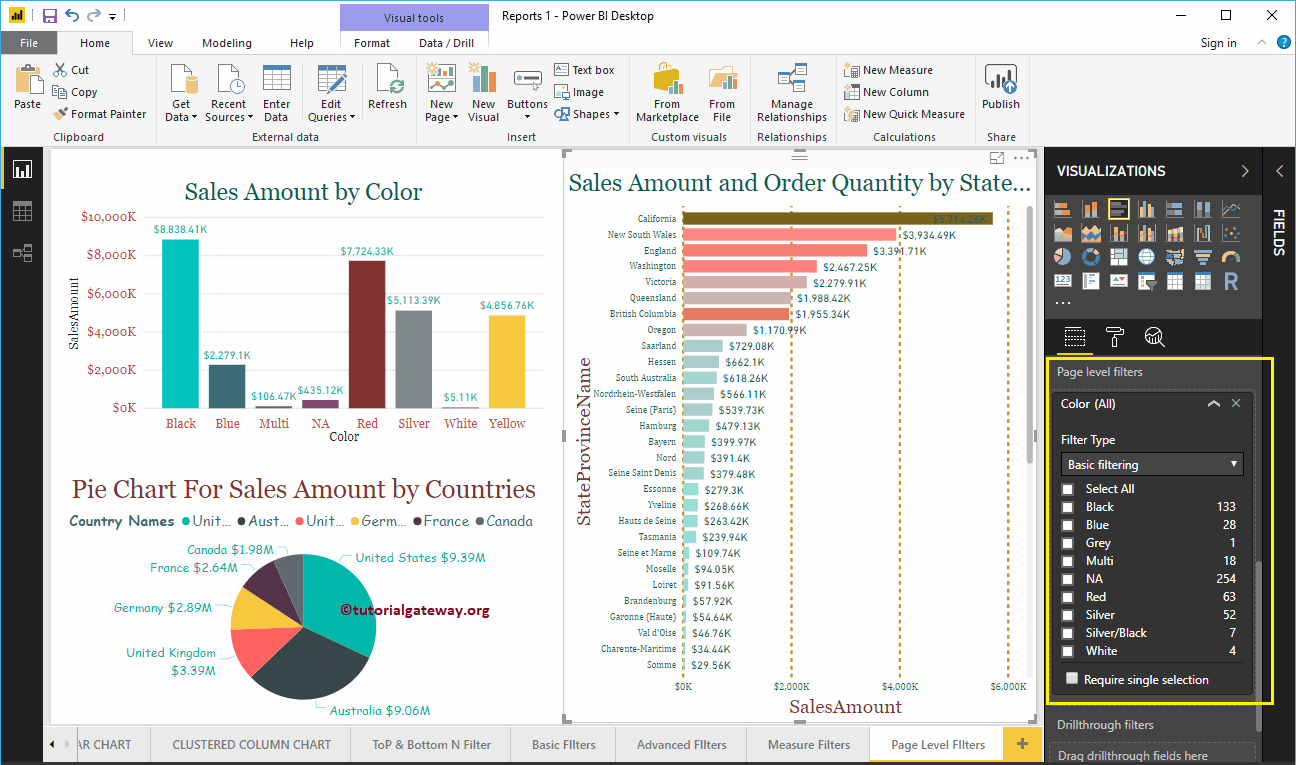
Select the colors blue, red, silver, and yellow as the basic filter fields.
In the screenshot below, you can see that the column chart shows the sales amount for the selected colors. The pie chart shows the sales amount of the selected product colors, and the bar chart shows the sales amount of the selected colors.

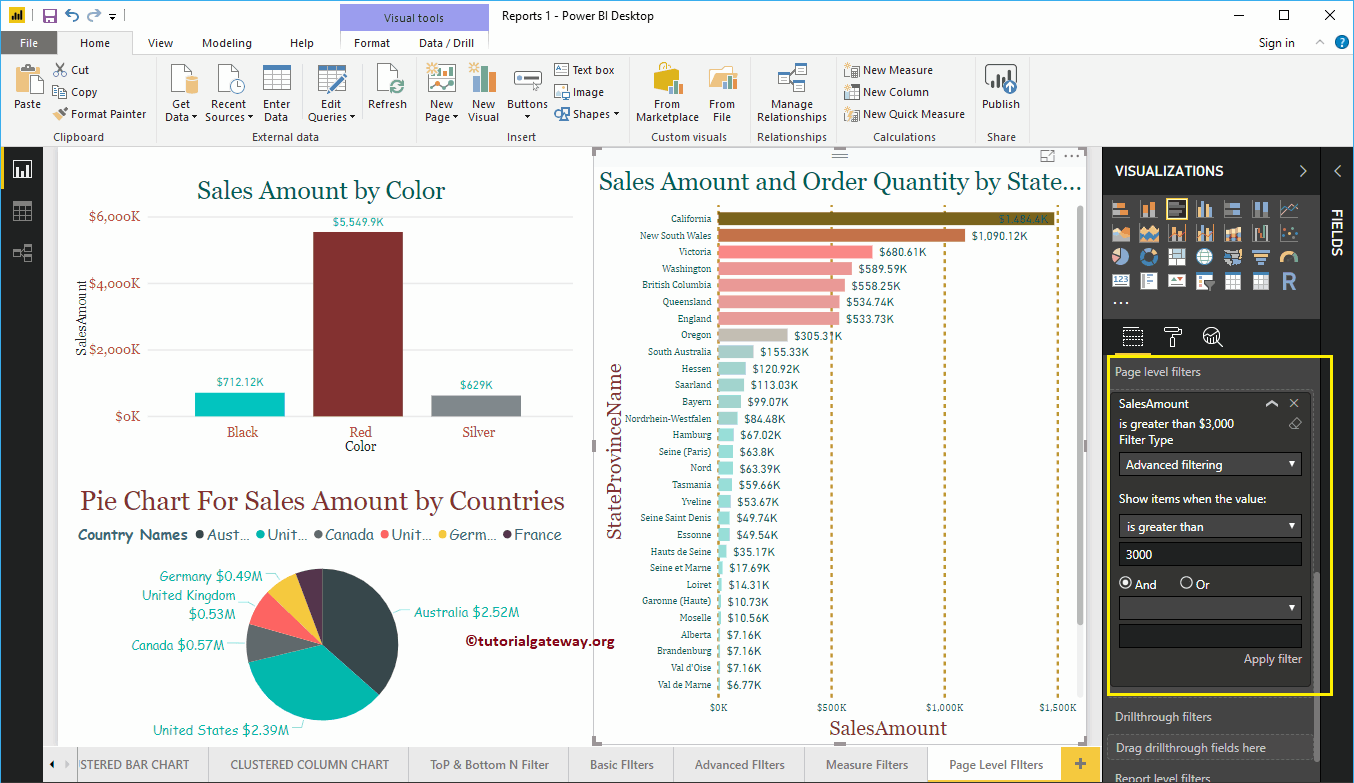
Let me remove the existing page level filters and drag and drop the Sales Amount section of the fields to the page level filters. Then expand Sales Amount to see the filter options. See the article Filters on measures to understand these options.
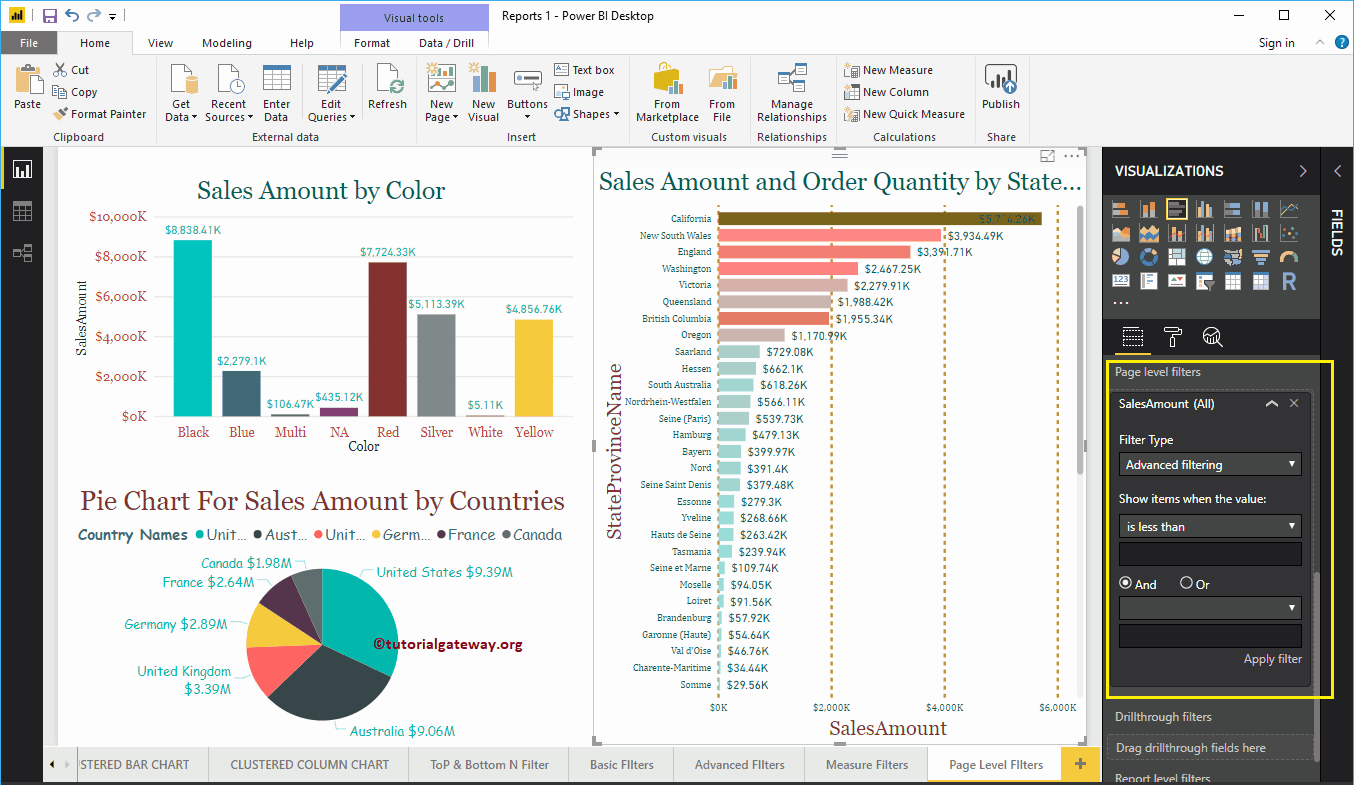

For this Power BI page-level filter demonstration purpose, we select is greater than as operator and 3000 as value. All the reports on the next page show countries or states with a Sales Amount greater than 3,000.