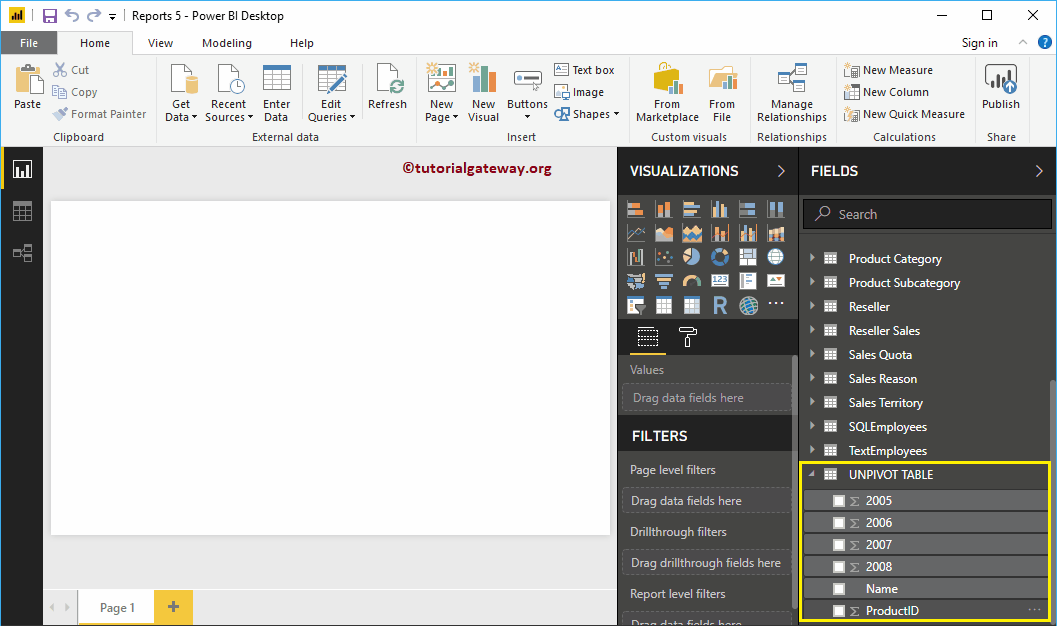
The pivot table option in Power BI converts selected rows to columns. Let me show you how to create pivot table or convert non-pivot table to pivot table in Power BI with an example.
How to create a Power BI pivot table
To create a Power BI pivot table or convert a change to a pivot table, click the Edit queries option under the Home tongue.
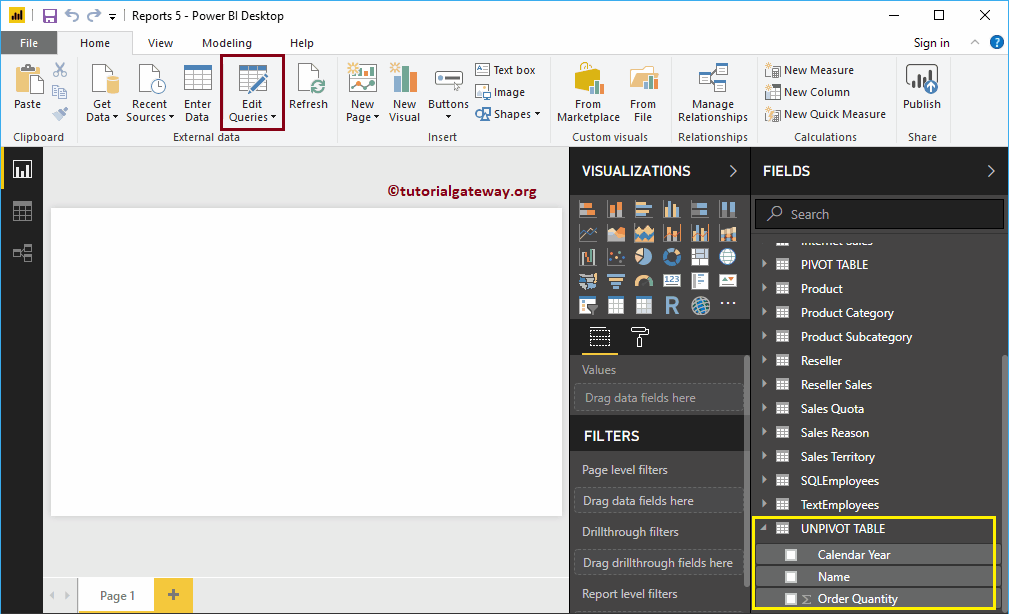
Clicking Edit queries The option opens a new window called Power BI Power Query Editor.
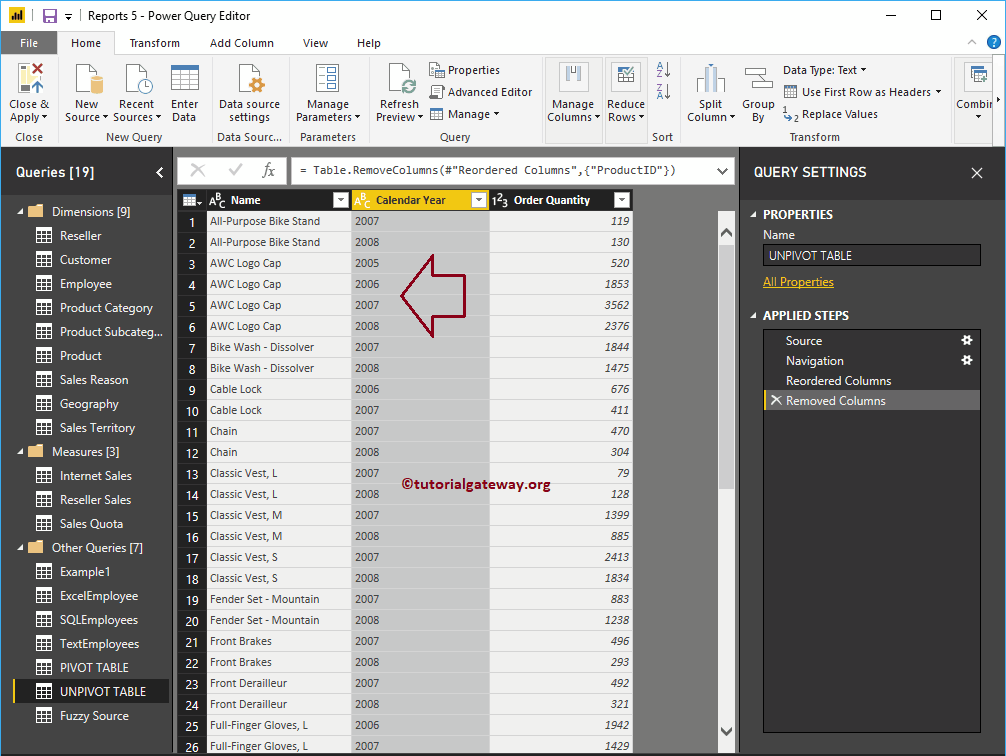
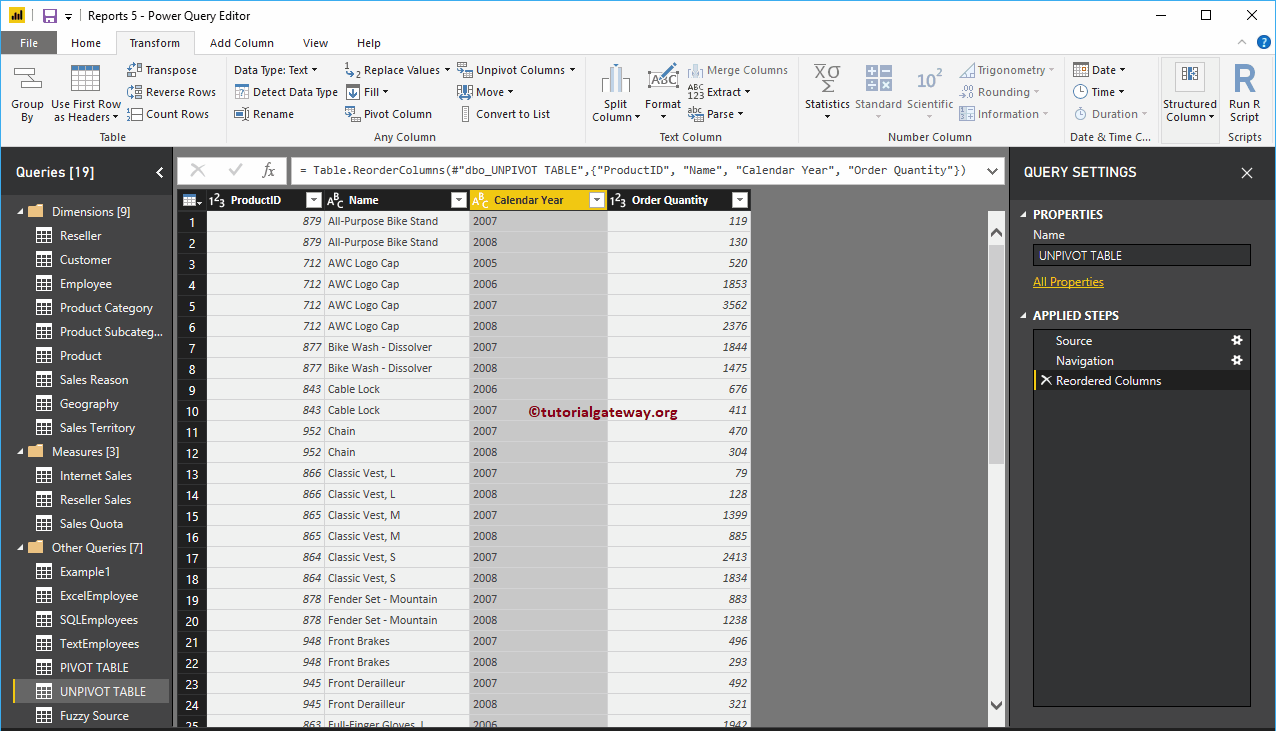
In this example, we are going to rotate the calendar year column based on the order quantity.
To convert the table without divisions to a pivot table, go to Transform Tongue. In this tab, you can find the pivot column button as shown below.
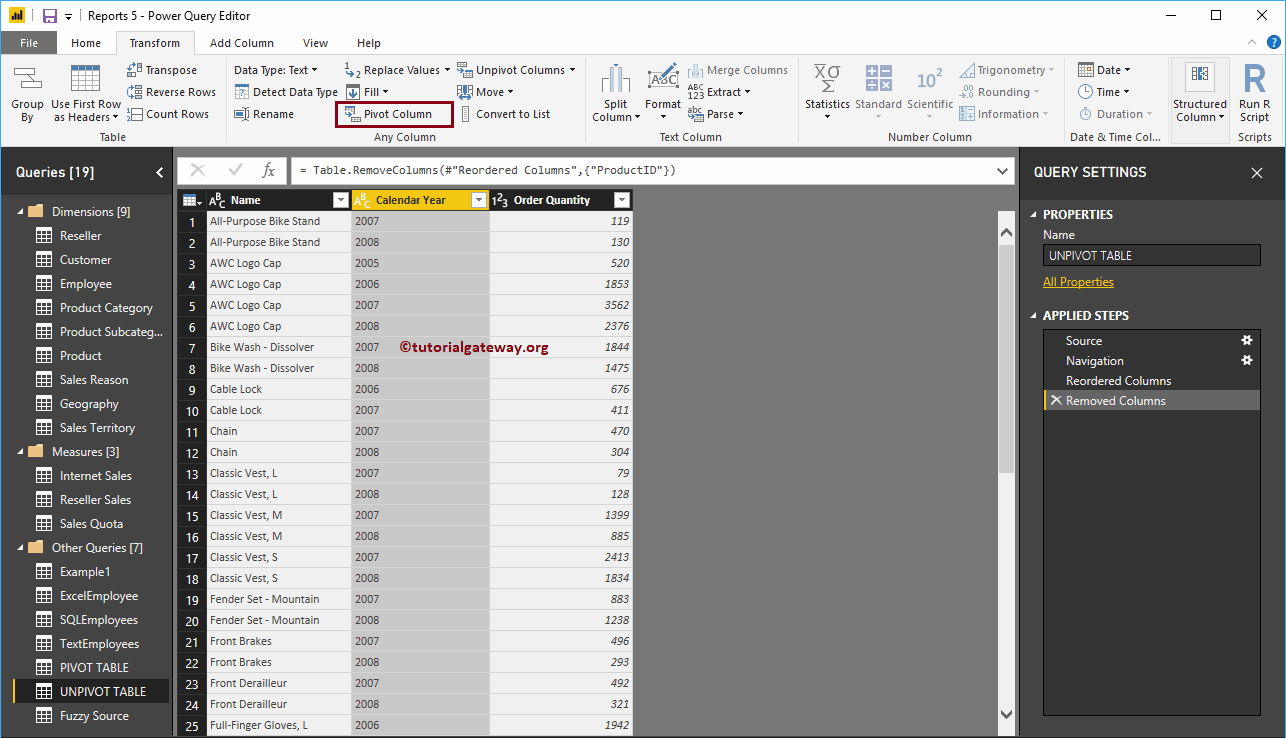
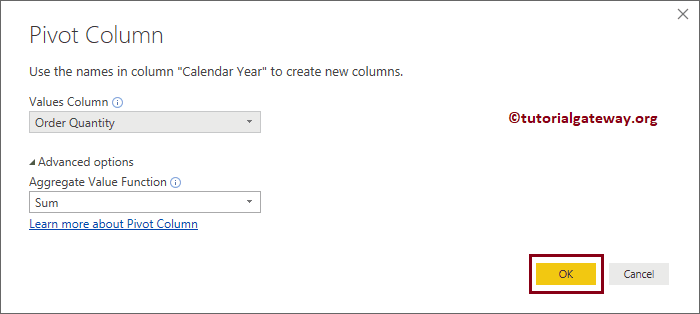
Clicking on the Dynamic Column button opens the following window.
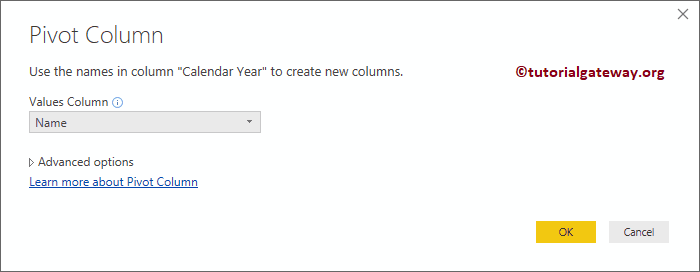
Let me select the order quantity as the value column
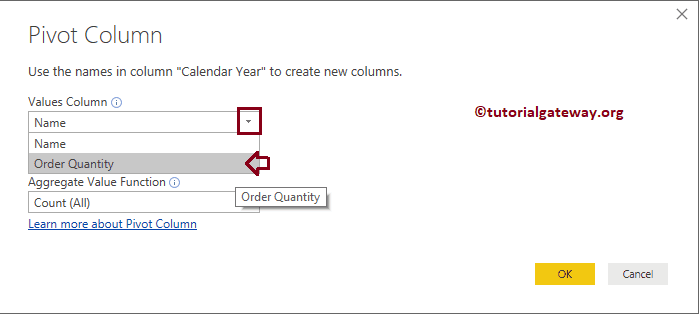
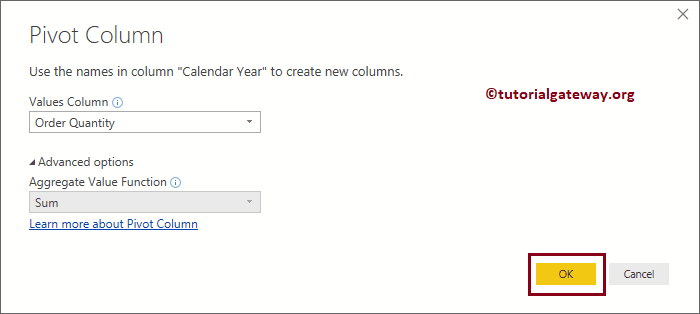
Next, we select the sum as the value of the aggregate function
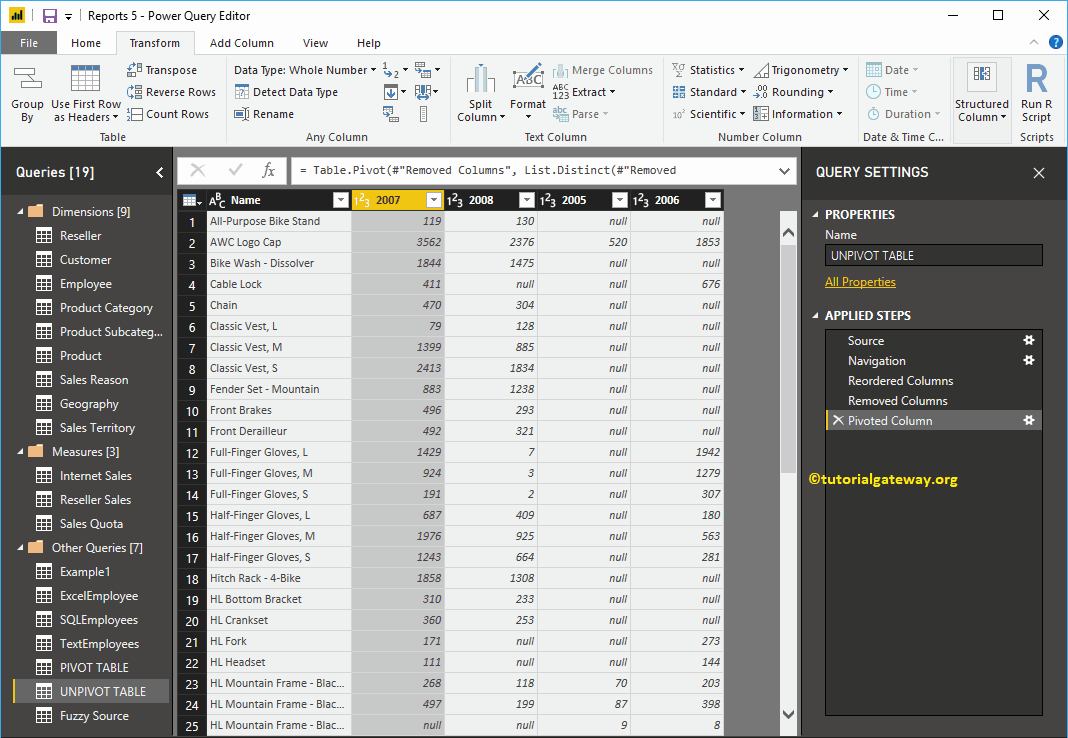
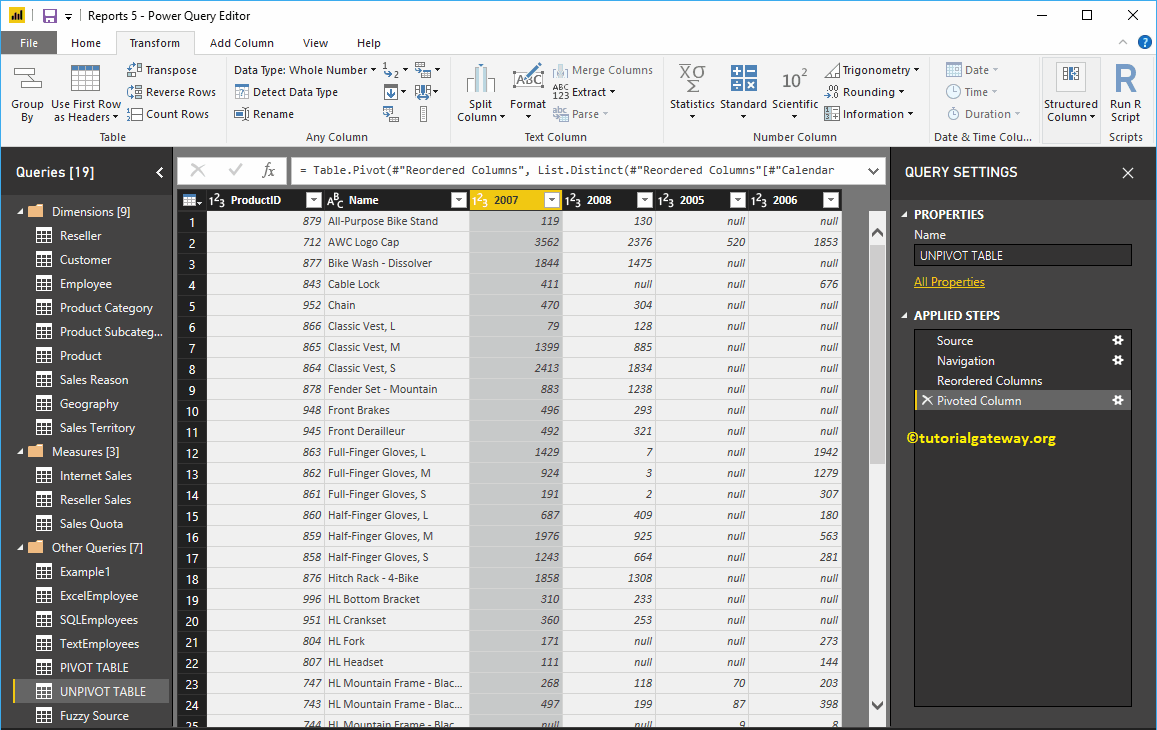
Now you can see the pivot table
What if your table has more than one static column (a column that will not change in the pivoting process)? For this, we add one more column called Product Id to this table.
Let me select the Order Quantity column as the value column and Sum as the aggregate function
Now you can see the pivot table in Power BI. Remember, having more than one static column without changes will make no difference in creating a pivot table.
Then press the Close and apply option under the Home tab to apply these changes.
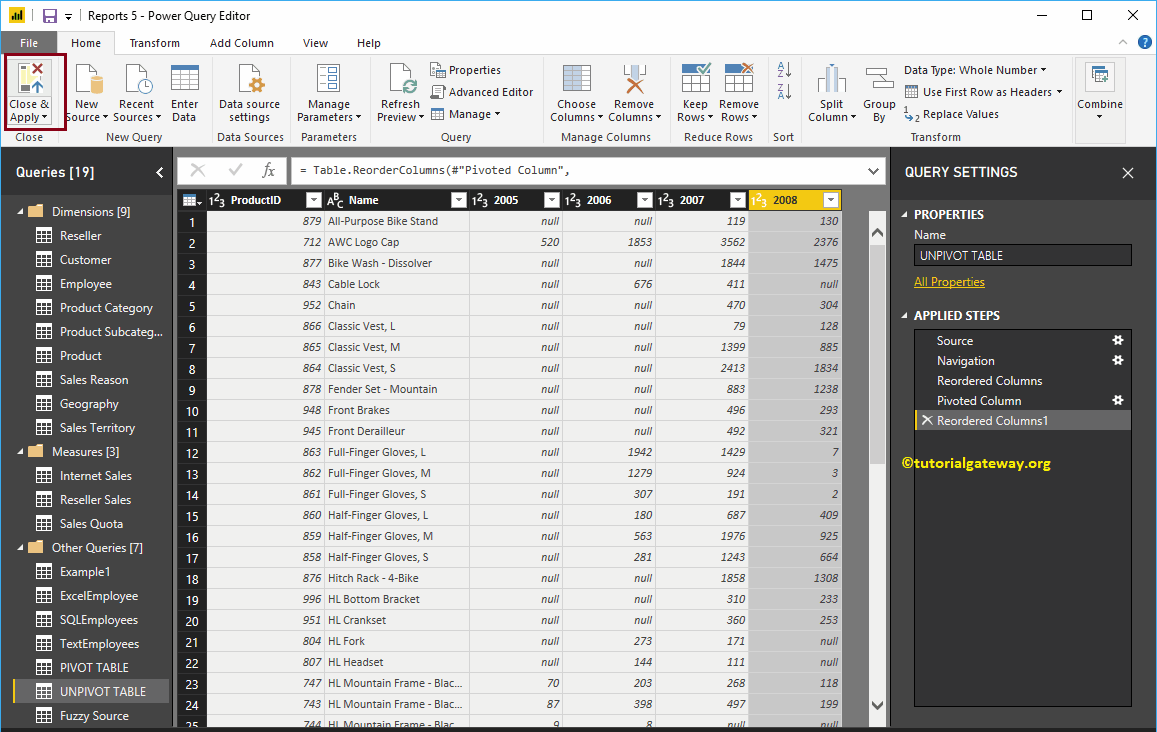

In the following screenshot, you can see the dynamic columns.