Power BI report-level filters are used to filter the visuals (or graphics) present on all pages of a report. For example, if your report contains 10 pages, you can use this report-level filter to filter those 10 pages at once. Let me show you how to create report-level filters in Power BI with an example.
To create this report (the page merge) for the Power BI report-level filter demonstration, we used the SQL data source that we created in our previous article.
See the article Connect Power BI to SQL Server to understand the data source.
How to create Power BI report level filters
To demonstrate report-level filters in Power BI, we'll use report 1 that we created in our previous posts. This Power BI report has 19 pages: column chart, pie chart, treemap, donut chart, bar chart, and so on.
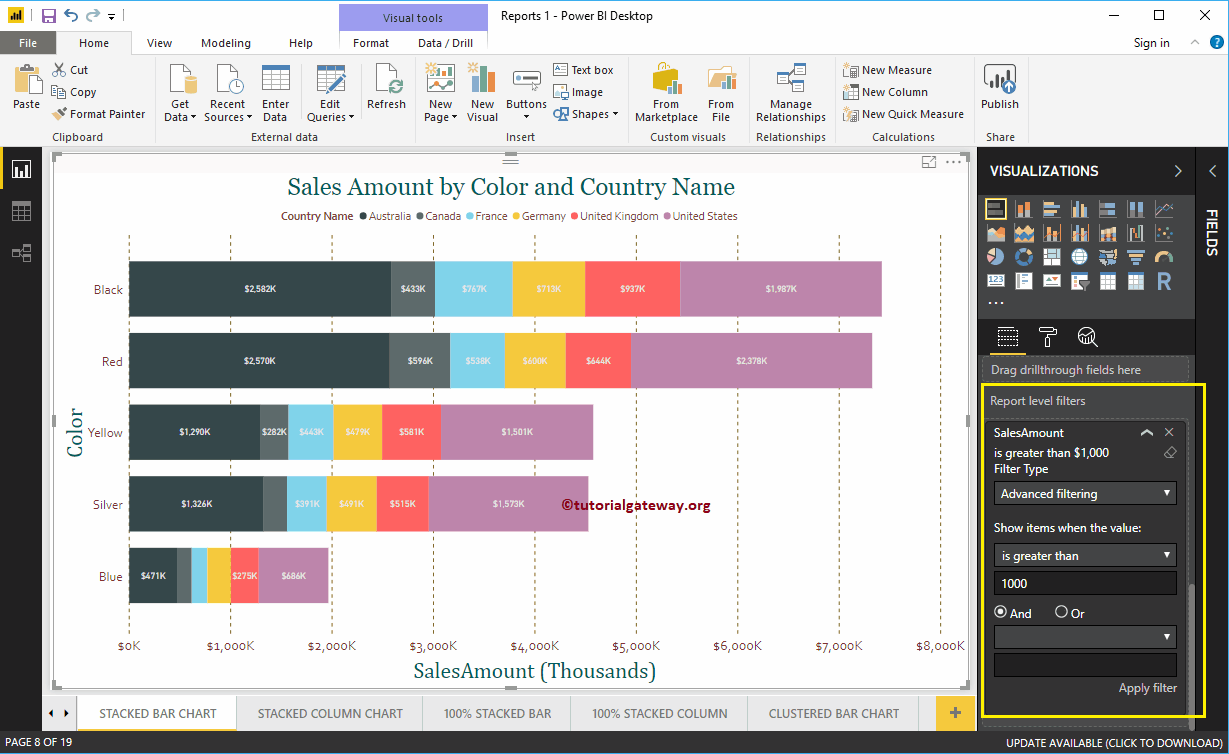
In this example, we create a report level filter on the stacked bar chart. Remember, this is the eighth page of a total of 19 pages.
As you can see in the screenshot below, we used the Color field as the axis, the Country Name field as the legend, and the sales amount as the Value field.
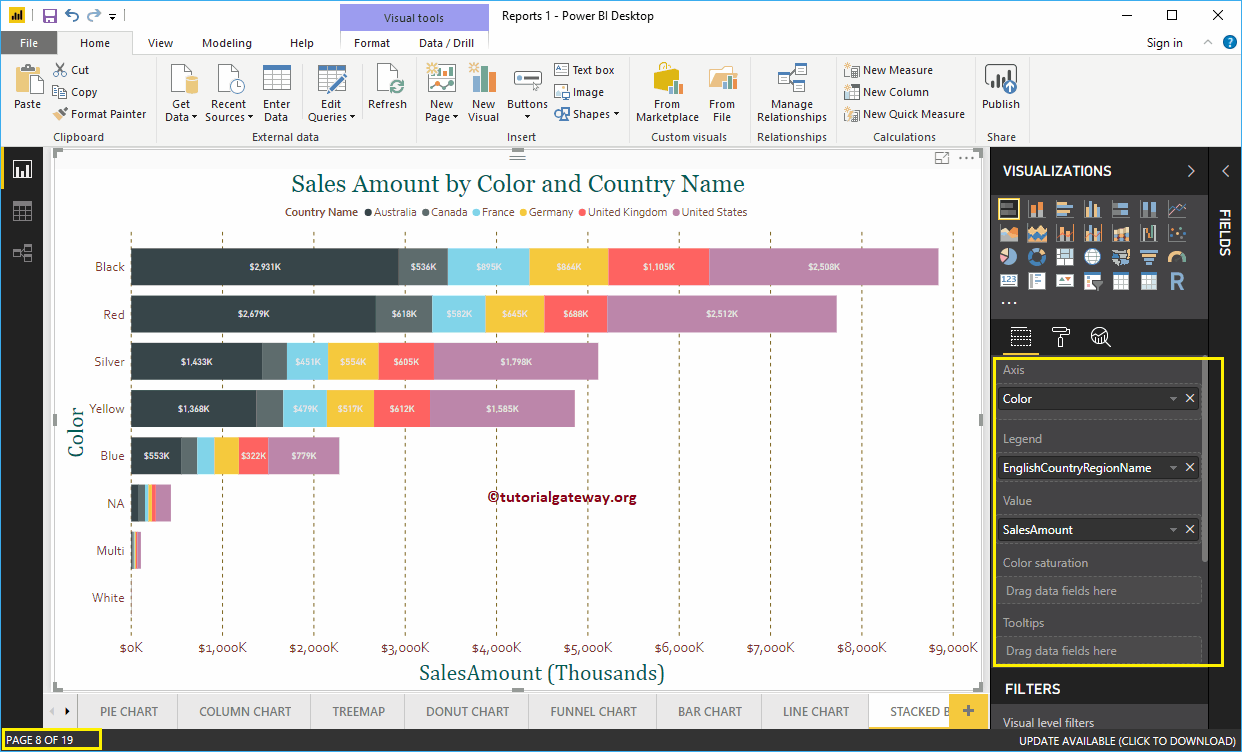
In the Filters section, you can see the list of report-level filters available in Power BI. You have to use the Report level filters section to create a report-level filter.
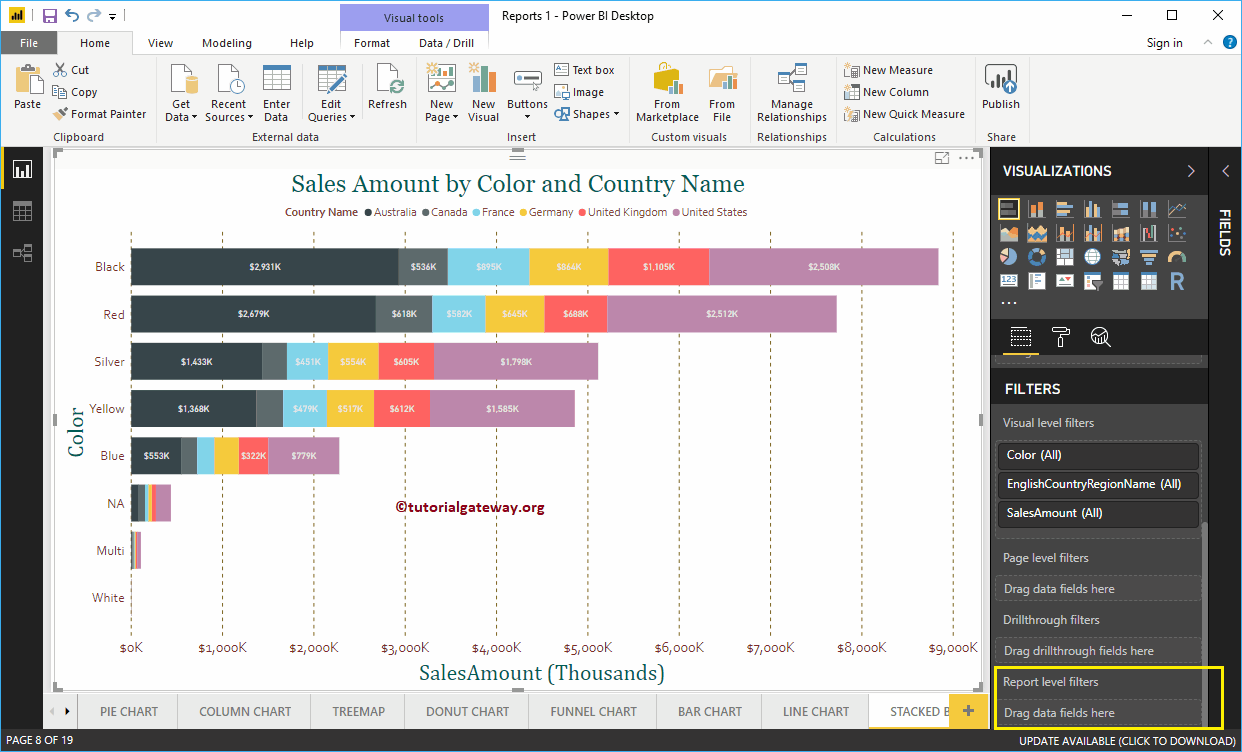
Let me drag and drop the English country region name from the fields section to the report level filters.
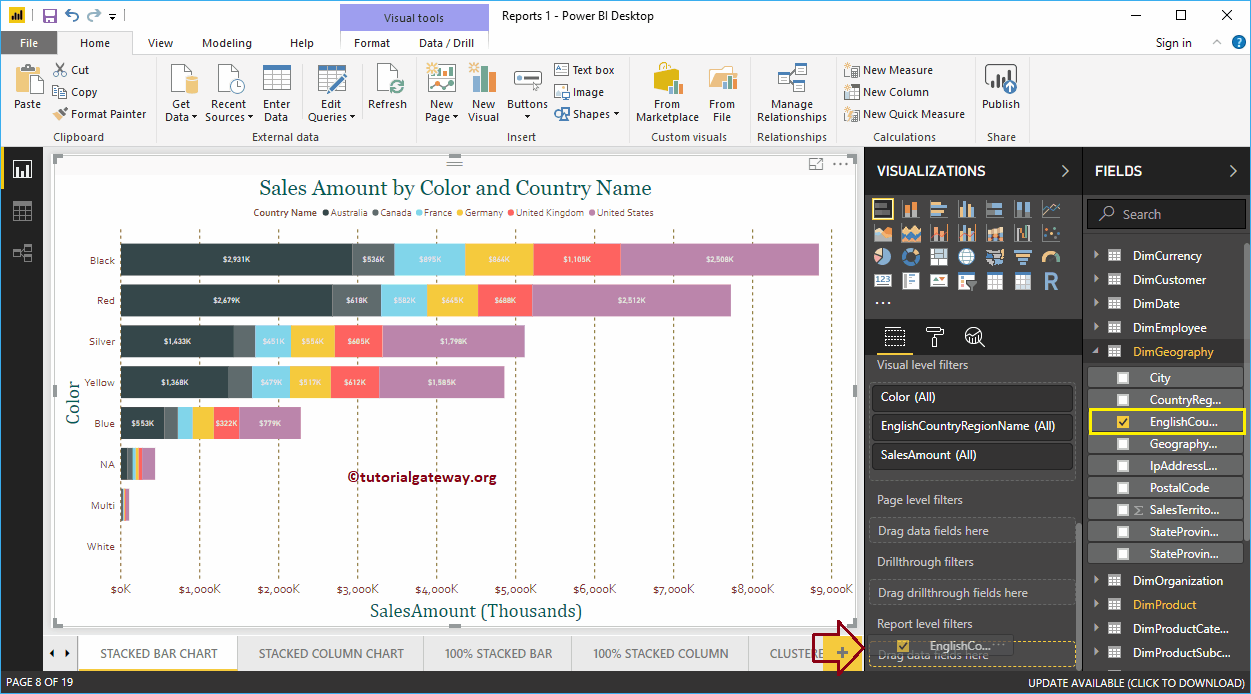
Expand the name of the country region in English to see the filter types. By default, the Basic Filters option selected as the Filter Type.
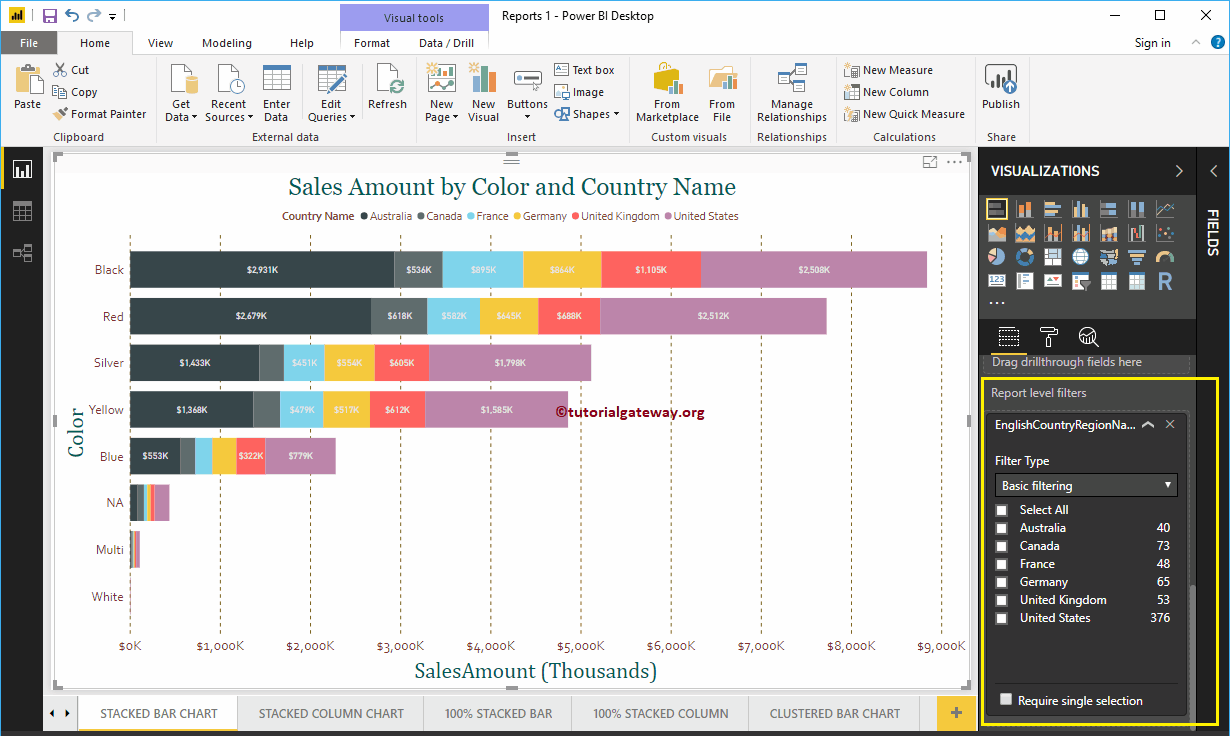
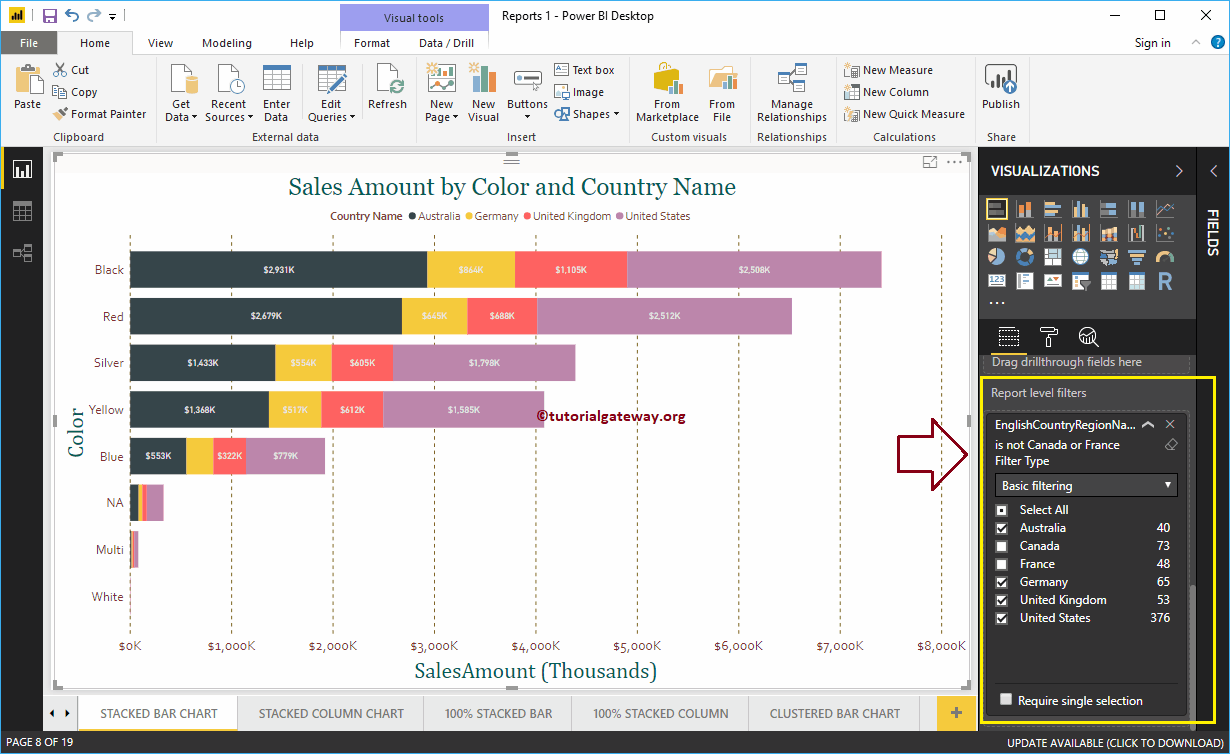
For this Power BI report-level filter demonstration purpose, we selected Australia, Germany, the United Kingdom, and the United States.
In the following screenshot, you can see that the stacked bar chart shows the sales of the selected countries in a legend.
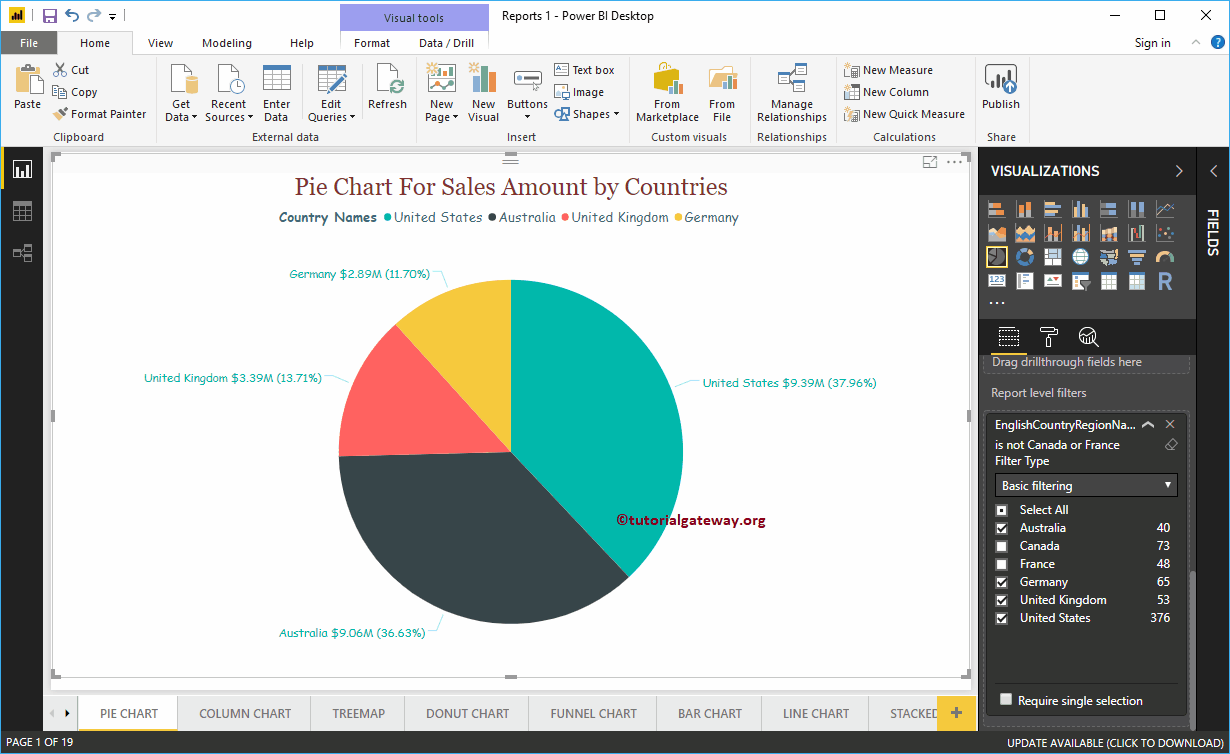
Let me navigate to page 1 of 19. As you can see in the screenshot below, the pie chart is also filtered by the report level filter. I mean, it shows the sales of the selected countries.
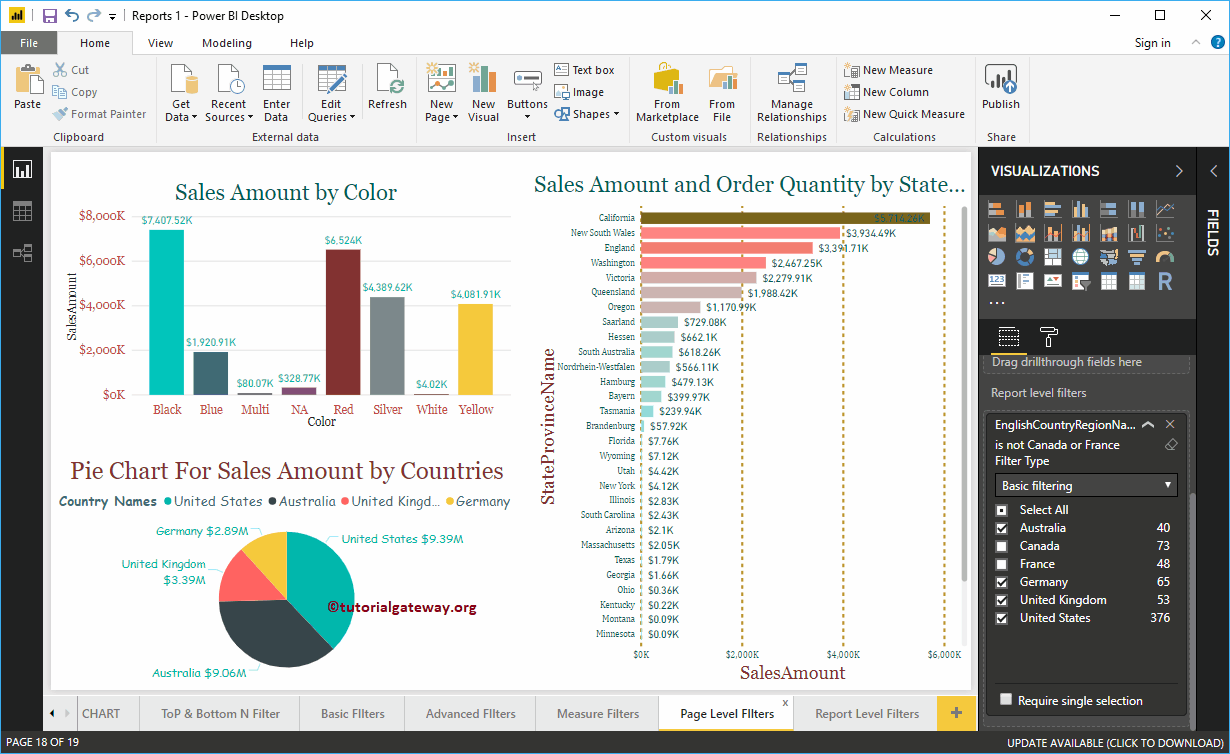
Let me navigate to page 18 of 19. In the screenshot below, you can see that Power BI report-level filters are filtering these three charts.
Use the drop-down menu to change the filtering type from report level to Advanced Filter.
Here, we are applying various filters on the Country column. The first filter checks whether the country contains a unified keyword or not. Or, the second filter checks for countries that do not start with F.

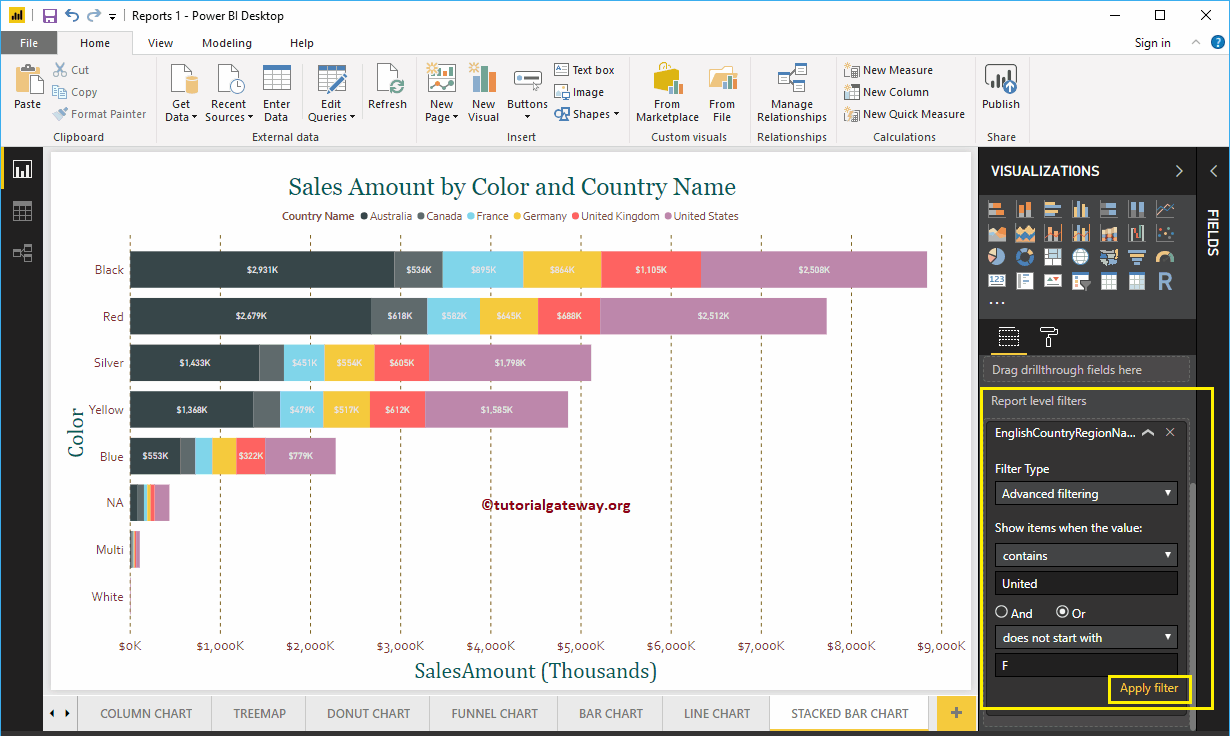
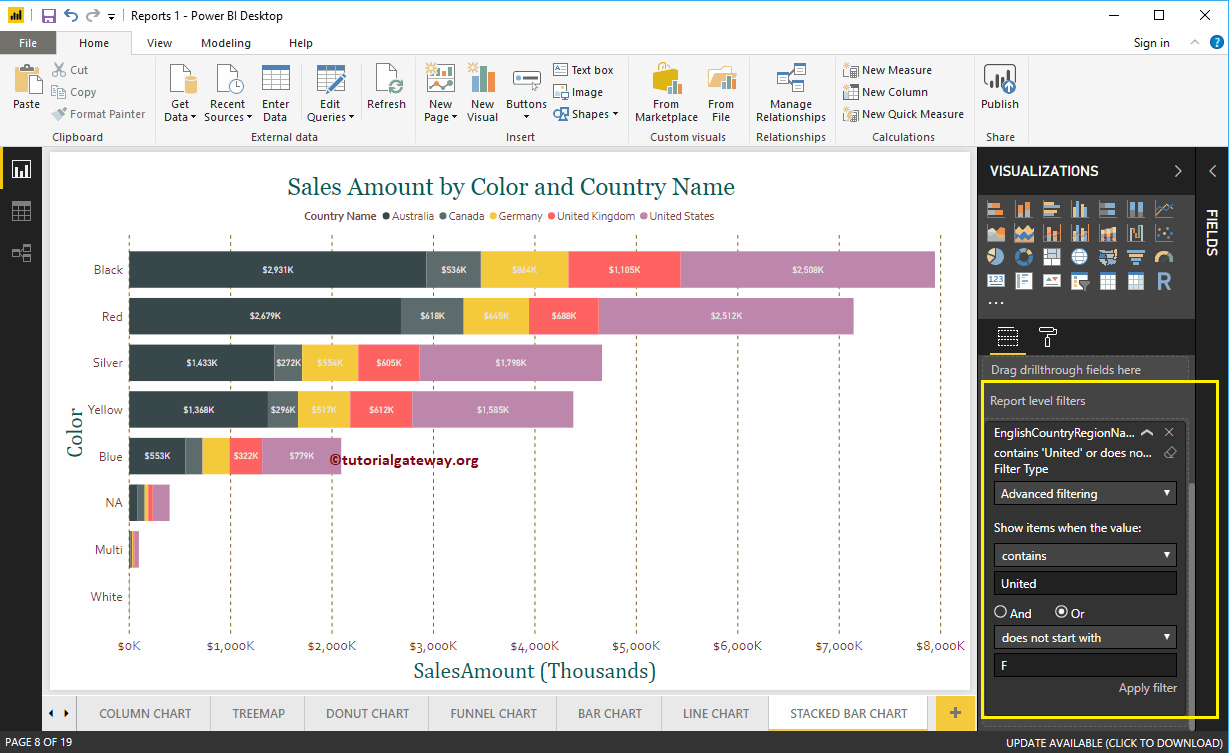
The following report shows the bars with countries containing the United keyword, and the countries did not start with F.

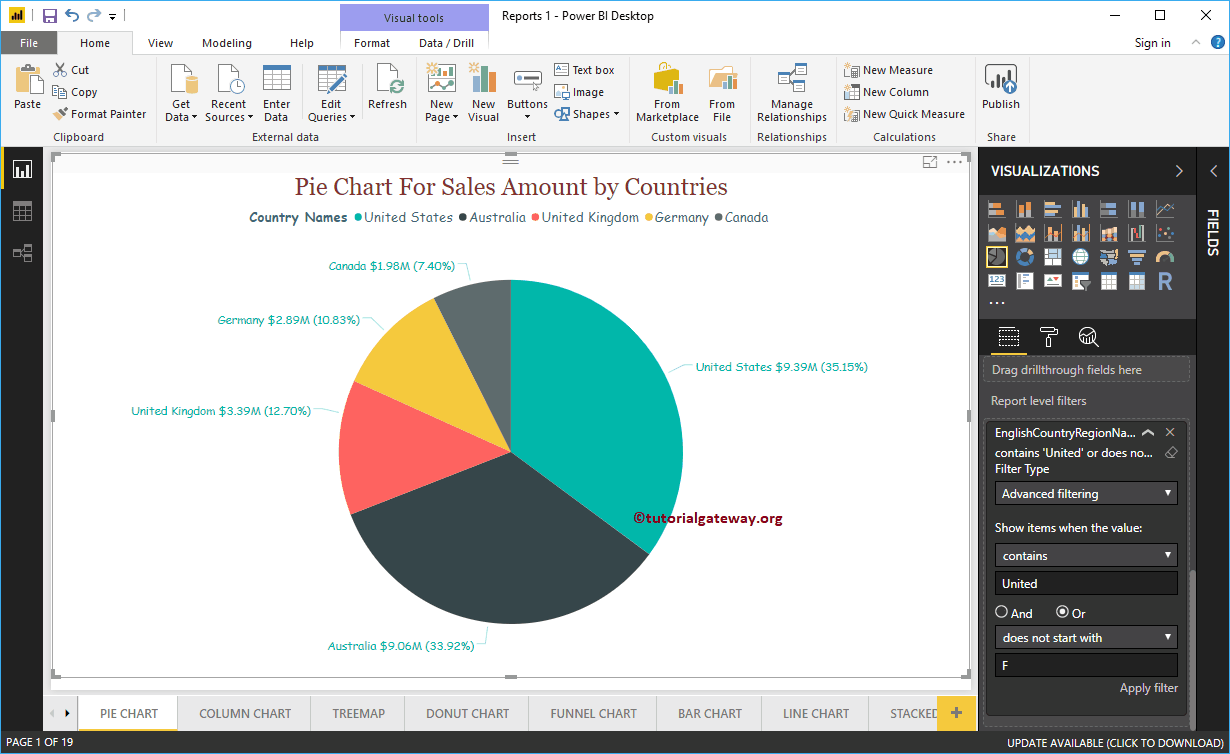
Let me navigate to page 1 of 19. As you can see, the pie chart shows sales for countries that contain united or countries that don't start with F

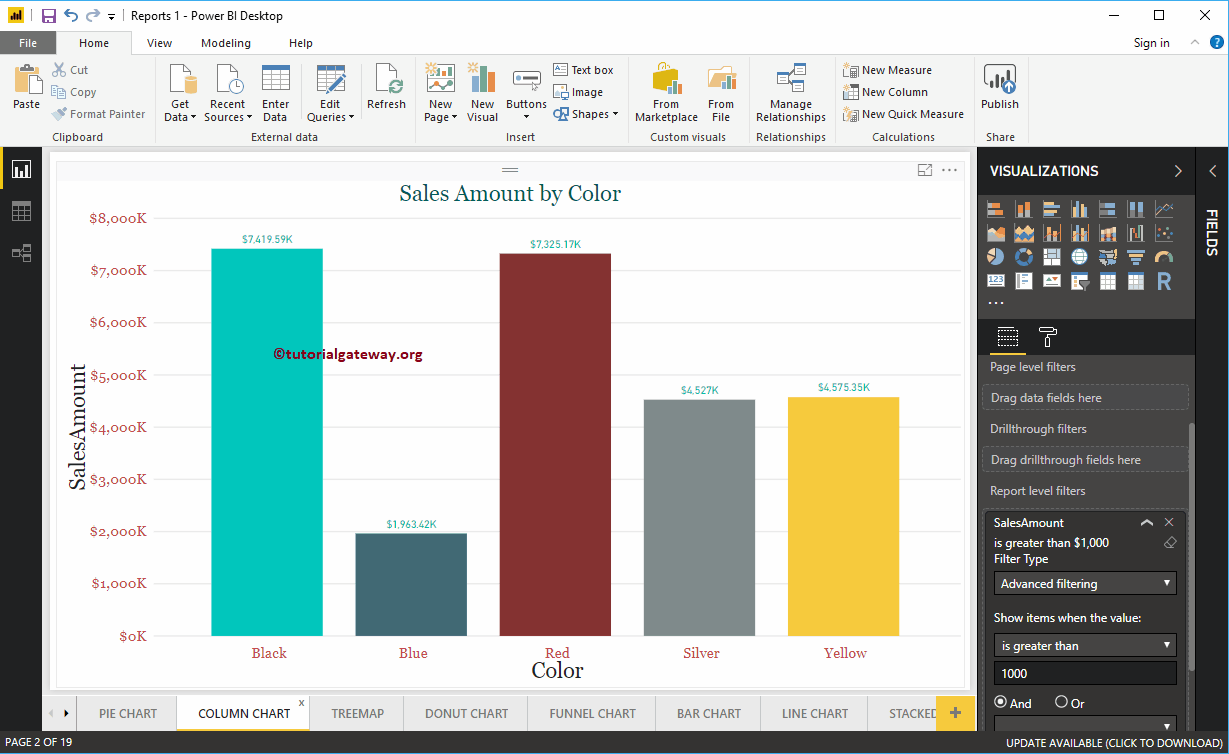
Let me remove the existing Power BI report level filters. Then drag and drop the Sales Amount from the fields section to the Filters report level. Then expand the Sales Amount to see the filter options. See the article Filters on measures to understand these options.

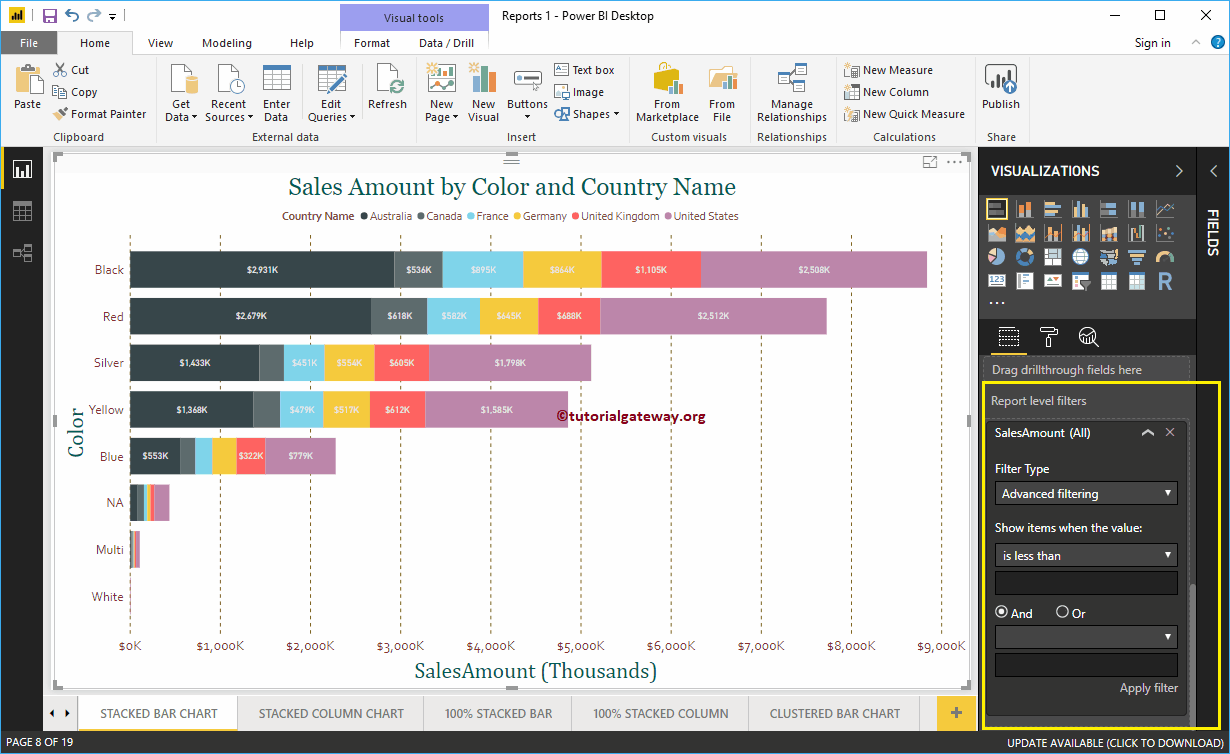
For the purpose of demonstration, we select is greater than as operator and 1000 as value. In the screenshot below, you can see that the stacked bar chart shows the bars whose sales amount is greater than 1000.

Now, you can see that the same filter was applied to the column chart present on page 2 of 19