How to measure Web Vitals with your current analysis tool.
Updated
Having the ability to measure and report on the actual performance of your pages is critical to diagnosing and improving performance over time. Without field data, it is impossible to know for sure if the changes you are making to your site are actually achieving the desired results.
Many popular Real user monitoring (RUM) Analytics providers already support Core Web Vitals metrics in their tools (as well as many other Web Vitals). If you are currently using one of these RUM analytics tools, you are in great shape to assess how well your site pages meet Core Web Vitals recommended thresholds and avoid regressions in the future.
While we recommend using an analysis tool that supports Core Web Vitals metrics, if the analysis tool you are currently using does not support them, you do not need to change. Almost all analysis tools offer a way to define and measure custom metrics or
events, which means you can probably use your current analytics provider to measure Core Web Vitals metrics and add them to your existing analytics reports and dashboards.
This guide discusses best practices for measuring Core Web Vitals metrics (or any custom metrics) with an internal or third-party analytics tool. It can also serve as a guide for analytics providers who want to add Core Web Vitals support to their service.
Use custom metrics or events
As mentioned above, most analytics tools allow you to measure custom data. If your analytics tool supports it, you should be able to measure each of the Core Web Vitals metrics using this mechanism.
Measuring custom metrics or events in an analytics tool is generally a three-step process:
- Define or register
the custom metric in your tool manager (if necessary). (Note: not all analytics providers require custom metrics to be defined in advance.) - Calculate the value of the metric in your frontend JavaScript code.
- Send the metric value to your analytics backend, making sure the name or ID matches what was defined in step 1 (again, if necessary).
For steps 1 and 3, you can refer to the documentation for your scan tool for instructions. For step 2, you can use the
web-vitals JavaScript library to calculate the value of each of the Core Web Vitals metrics.
The following code example shows how easy it can be to track these metrics in code and send them to an analytics service.
import { getCLS , getFID , getLCP } from 'web-vitals' ; function sendToAnalytics ( { name , value , id } ) {
 const body = JSON . stringify ( { name , value , id } ) ;
 ( navigator . sendBeacon && navigator . sendBeacon ( '/ analytics' , body ) ) ||
 fetch ( '/ analytics' , { body , method : 'POST' , keepalive : true } ) ;
 } getCLS ( sendToAnalytics ) ;
 getFID ( sendToAnalytics ) ;
 getLCP ( sendToAnalytics ) ;
Make sure you can report a distribution
Once you have calculated the values for each of the Core Web Vitals metrics and submitted them to your analytics service using a custom event or metric, the next step is to create a report or dashboard that shows the values that have been collected.
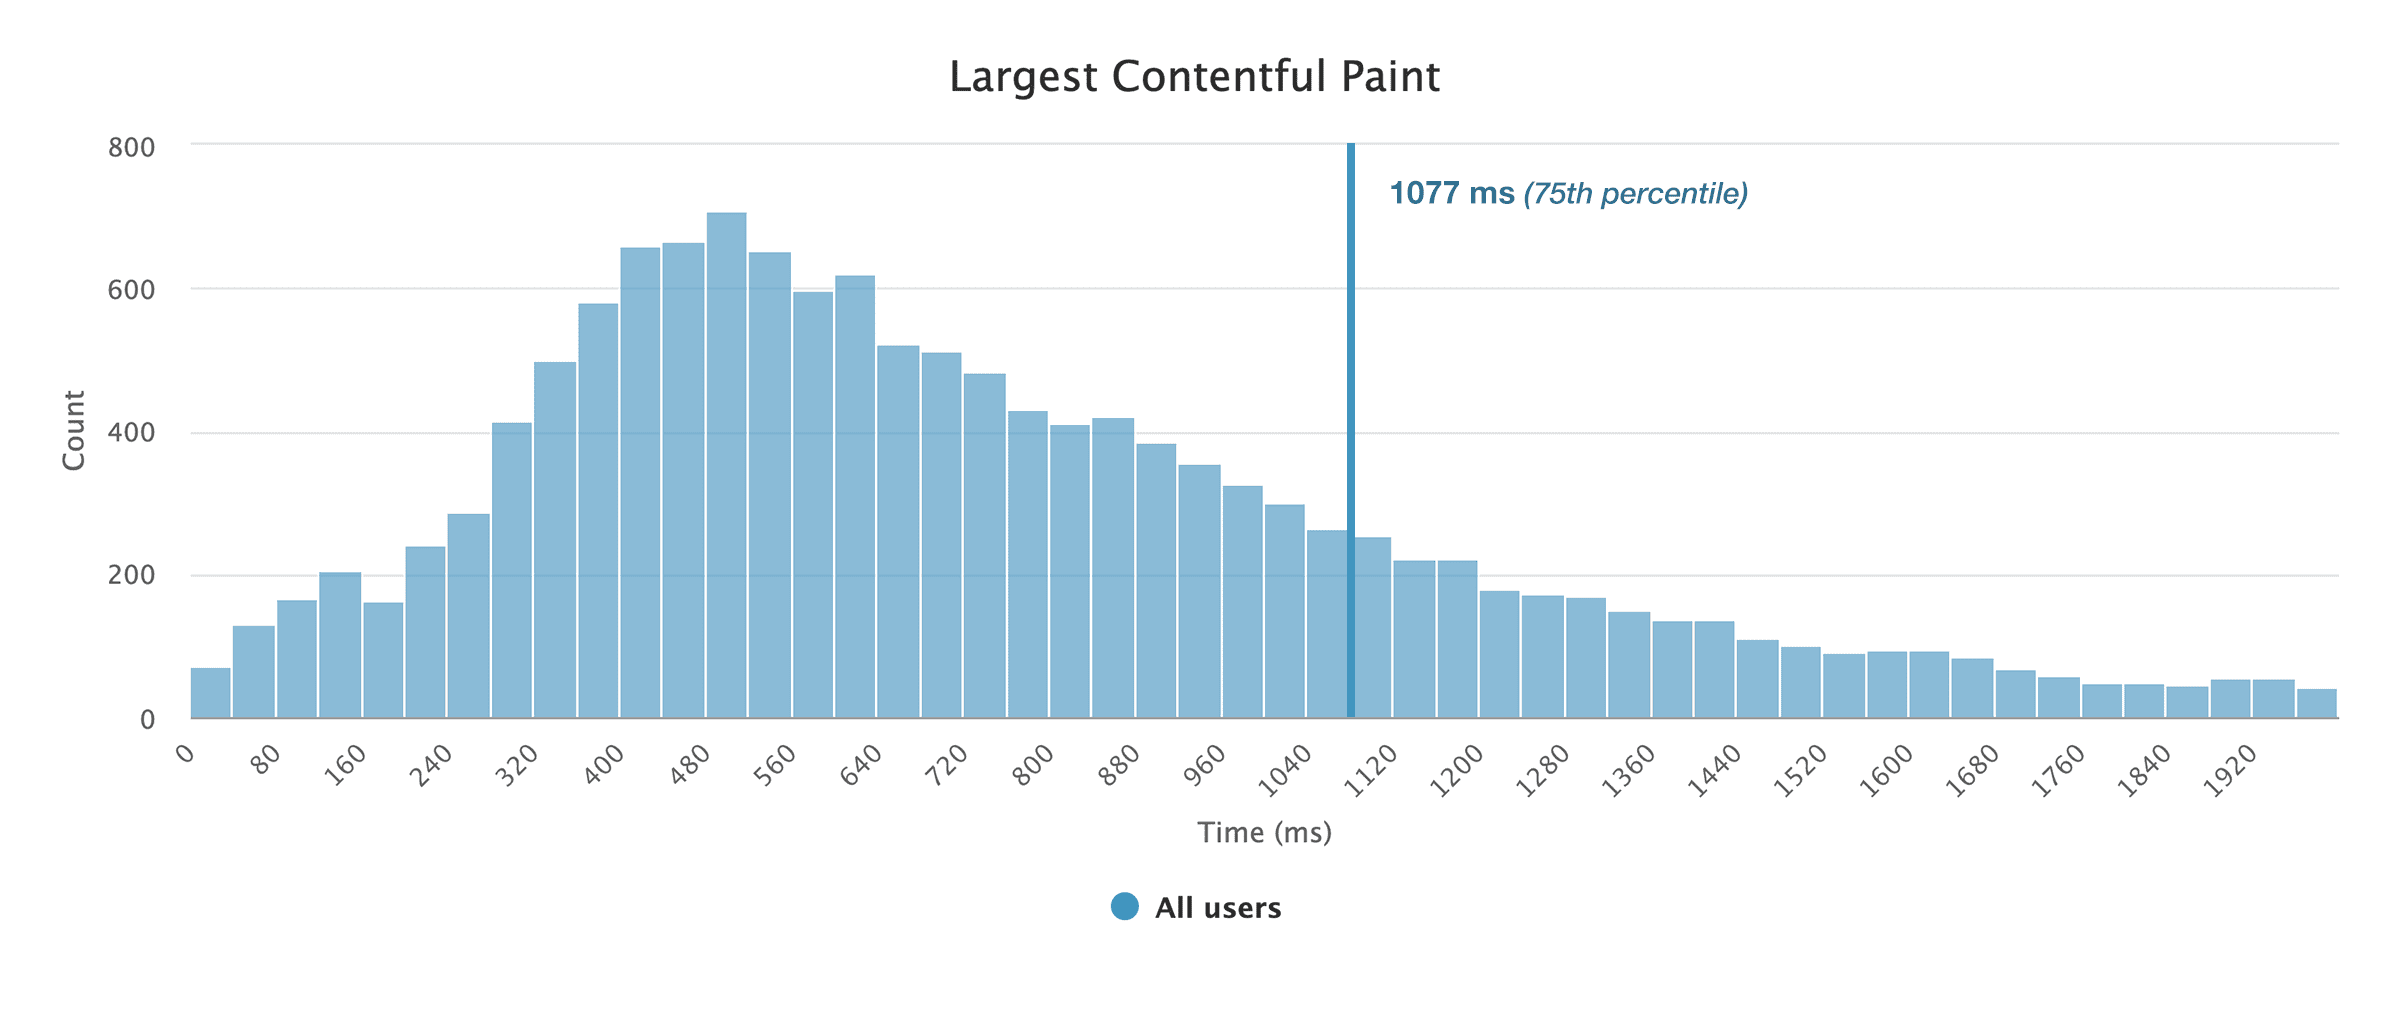
To ensure that you meet the Core Web Vitals recommended thresholds, you will need your report to show the value of each metric at the 75th percentile.
If your analytics tool doesn't offer quantile reporting as a built-in function, you can probably still get this data manually by generating a report that lists all the metric values sorted in ascending order. Once this report is generated, the result that is the 75% of the way through the complete and ordered list of all the values in that report will be the 75th percentile for that metric, and this will be the case no matter how you segment your data. (by device type, connection type, country, etc.).
If your analytics tool doesn't give you metric-level reporting granularity by default, you can probably achieve the same result if your analytics tool supports custom dimensions. By setting a unique custom dimension value for each individual metric instance that you track, you should be able to generate a report, broken down by individual metric instances, if you include the custom dimension in your report settings. Since each instance will have a unique dimension value, no grouping will occur.
For example, the following histogram was generated from Google Analytics using the technique described above (since Google Analytics does not support quantile reports in any of its standard reports). The data were consulted using the
Analytics reporting API and is displayed by a JavaScript data visualization library:
Tip: the web-vitals The library provides an ID for each reported metric instance, making it easy to create distributions in most analysis tools. Watch the
Metric interface documentation for more details.
Submit your details at the right time
Some performance metrics can be calculated after the page has finished loading, while others (like CLS) consider the full life of the page and are only final after the page has started to download.
However, this can be problematic, as both the beforeunload and unload
Events are unreliable (especially on mobile devices) and their use is not recommended
(as they can prevent a page from being eligible for Cache back).
For metrics that track the entire lifetime of a page, it is best to send the current value of the metric during the visibilitychange event, whenever the visibility state of the page changes to hidden. This is because once the page's visibility status changes to hidden: There is no guarantee that any script on that page will be able to run again. This is especially true on mobile operating systems where the browser application itself can be closed without any page callbacks being triggered.
Note that mobile operating systems generally enable visibilitychange
event when switching tabs, switching applications or closing the browser application. They also shoot the visibilitychange event when closing a tab or navigating to a new page. This makes the visibilitychange much more reliable event than the
unload or beforeunload events.
Because some browser errors, there are some cases where visibilitychange the event does not fire. If you are creating your own analysis library, it is important to be aware of these errors. Note that the web-vitals
The JavaScript library takes all of these errors into account.
Monitor performance over time
Once you've updated your analytics implementation to track and report on Core Web Vitals metrics, the next step is to track how changes to your site affect performance over time.
Version of your changes
A naive (and ultimately unreliable) approach to tracking changes is to implement changes in production and then assume that all metrics received after the implementation date correspond to the new site and all metrics received before the implementation date correspond to the previous site. However, any number of factors (including caching at the HTTP layer, service worker, or CDN) can prevent this from working.
A much better approach is to create a unique version for each change implemented and then track that version in your analysis tool. Most analysis tools support setting a version. If yours doesn't, you can create a custom dimension and set that dimension in your deployed version.
Run experiments
You can take version control one step further by tracking multiple versions (or experiments) at the same time.
If your analysis tool allows you to define groups of experiments, use that function. Otherwise, you can use custom dimensions to ensure that each of your metric values can be associated with a particular experiment group in your reports.
With experimentation in place of analysis, you can implement an experimental change on a subset of your users and compare the performance of that change with the performance of users in the control group. Once you are confident that a change actually improves performance, you can implement it for all users.
Run groups should always be set up on the server. Avoid using any A / B testing or experimentation tool that runs on the client. These tools will typically block rendering until a user's run group is determined, which can be detrimental to their LCP times.
Make sure measurement does not affect performance
When measuring performance on real users, it is absolutely critical that any performance measurement code you are running does not negatively affect the performance of your page. If so, any conclusions you try to draw about how your performance affects your business will not be reliable, as you will never know if the presence of the analytical code itself is having the biggest negative impact.
Always follow these principles when implementing RUM analysis code on your production site:
Postpone your analyzes
Analysis code should always be loaded asynchronously and without blocking and should generally be loaded last. Blocking your scan code can negatively impact LCP.
All APIs used to measure Core Web Vitals metrics were specifically designed to support lazy and asynchronous script loading (via the
buffered flag), so there is no need to rush to load your scripts ahead of time.
In the event that you are measuring a metric that cannot be calculated later in the page load timeline, you need to include only the code that should be run early in the of your document (so it's not a processing lock request) and postpone the rest. Don't load all your analyzes ahead of time just because a single metric requires it.
Don't create long tasks
Parsing code often runs in response to user input, but if your parsing code is performing a lot of DOM measurements or using other processor intensive APIs, the parsing code itself can cause poor input response. Also, if the JavaScript file that contains your parsing code is large, running that file can crash the main thread and negatively affect FID.
Use non-blocking API
API like
sendBeacon ()
and
requestIdleCallback ()
They are specifically designed to perform non-critical tasks in a way that does not block critical tasks for the user.
These APIs are great tools to use in a RUM analysis library.
In general, all analytical beacons should be sent using the sendBeacon () API (if available) and all passive analytics measurement code must be run during periods of inactivity.
For guidance on how to maximize the use of downtime, while still ensuring code can be run urgently when needed (such as when a user is downloading the page), see the
inactive-until-urgent
Pattern.
Don't track more than you need
The browser exposes a large amount of performance data, but the fact that the data is available does not necessarily mean that it should record it and send it to its analytics servers.
For example, him Resource time API
provides detailed time data for each resource uploaded to your page. However, it is unlikely that all of that data is necessary or useful to improve resource load performance.
In short, don't just track the data because it's there, make sure the data will be used before consuming resources to track it.