Have you bought a car or a service that will be provided in the future? If so, they will have offered you, either online or by mail, a proforma invoice. It is…
If you need software to manage your company's payroll that is at the same time free and that is authorized by social security, you must accredit Nominasol. Nominasol is a ...
When we hear that a company has carried out or is seeking a capital increase, we imagine an IBEX 35 company, or a company that has just started its activity in ...
Los servicios financieros globales se vieron saturados durante los meses más largos de aislamiento. Hoy que la situación mejora lentamente y de manera desigual, muchas de las personas que todavía…
The quality department of an organization is the one that coordinates this search for excellence in compliance with the regulations that regulate this matter. Professionalism and confidence of ...
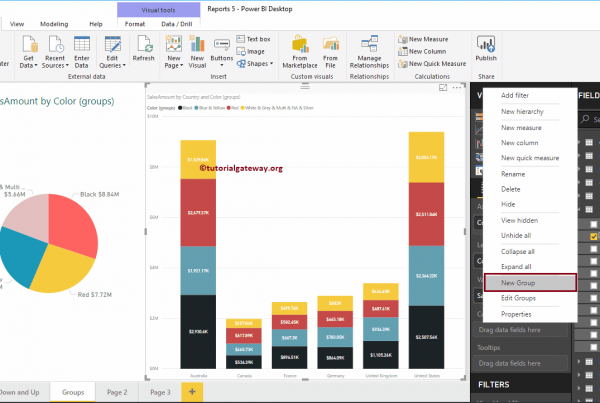
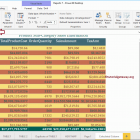
Power BI grouping is the process of combining or merging two or more values for more detailed analysis. For example, when we see a report of products by ...
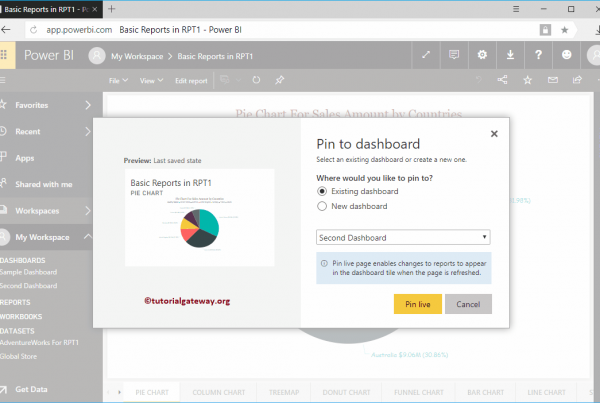
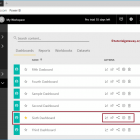
How to add reports to Power BI dashboard with a practical example? Before moving on to the actual example of Adding reports to the Power BI dashboard, let me show you the dashboards ...
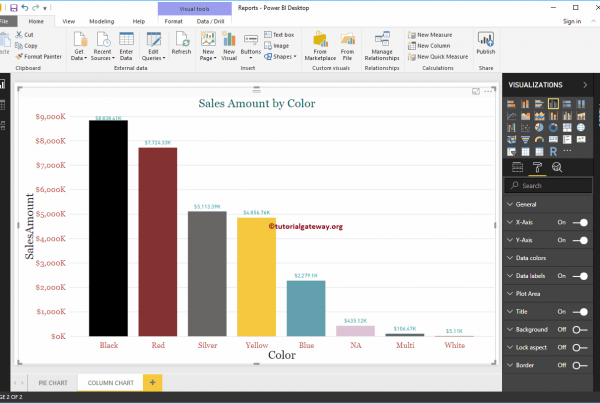
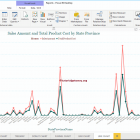
The Power BI column chart is very useful for visually comparing categorical data. For example, if we want to compare Sales by product group or Color, we can use ...
What is lenovo eye distance system.exe? lenovo eye distance system.exe is an executable file that is part of the Lenovo Eye Distance System program developed by Lenovo. The software…
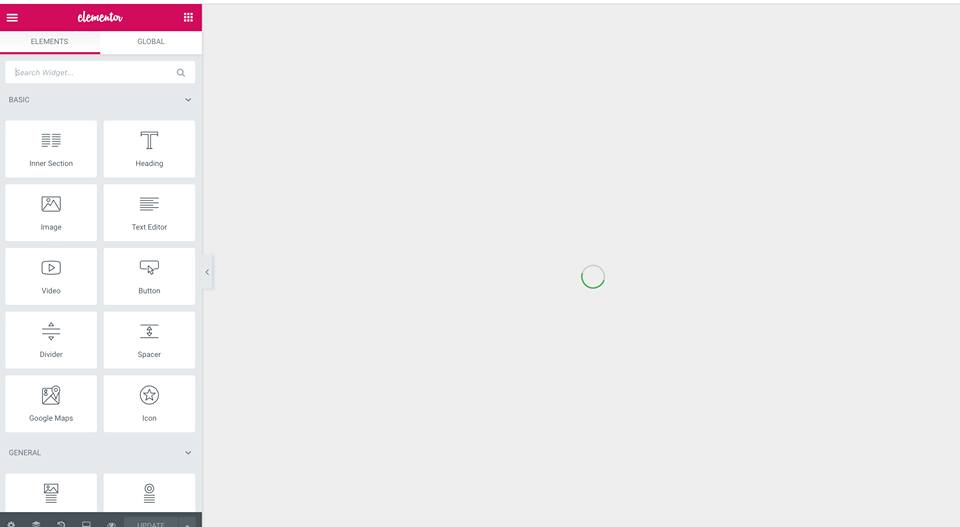
With the release of Elementor Theme Builder, you can work with any theme and design its header, footer, individual posts, and archive page. If you are a developer or ...
- PUBLICITY- The authorities of Mexico City announced that the Aztec capital returned to a red light, which implies, among other measures, the closure of squares...
When we search for something in the Windows 10 start menu, if there is nothing that results on the computer, it is recommended to search the Internet. This is done using Bing ...
In order to seek higher returns, it will be necessary to resort to more innovative investment alternatives. As an example with the contracting of mobile bank deposits or investment in gold. ...
How to remove duplicate LinkedIn account? If you happen to have two LinkedIn accounts, it would be good and necessary for you to delete one of them. Likewise, if you want to create one ...
On more than one occasion, as you can see in these tutorials, we need to make use of a command prompt window in Windows 10. It is necessary to be able to carry out certain processes. ...
- ADVERTISING- The first trailer for Z, a horror movie that assures us that children's imaginary friends may not necessarily be good and harmless "beings". Brandon ...
- ADVERTISING- If you are one of those who is looking forward to Disney +, you will be interested to know which devices will be compatible with the service. In recent years we have witnessed ...
Thanks to devices such as mobile phones or digital cameras, image management is more common than years ago. This makes it more common to use image editors like ...
If you read the post "5 keys to get more followers on Instagram" that we published a few days ago, you will remember that one of the key points to get more followers on Instagram…
Tik Tok is a social network that increases its strength with the passage of time, being today a network with more than 800 users in all parts of the world. It…
Display products on any page of your site, setting their content and style with the WooCommerce Products widget. Content Products Columns: Set the exact number of columns to be ...
Most people decide not to invest in the Stock Market because it gives them a certain respect for the ignorance of the field. It is natural, since it is always recommended that ...
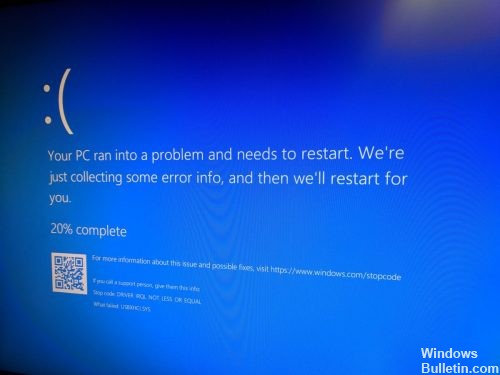
RECOMMENDED: Click here to fix Windows errors and get the most out of system performance Blue Screen of Death error USBXHCI.SYS has something to do with…
The Navigation Menu widget allows you to use menus that you have created in WordPress and design them the way you want. Watch this video that explains the various features of ...
In recent months, many developers have tried the mobile device is the only device or object that we have in our pocket. For this, several payment methods have come out ...
PRESENTATION The Master in Coaching, Emotional Management and Mindfulness will help you develop the essential skills to be able to channel emotions in relationships within the company. It will permit you…
- ADVERTISING- In recent days Netflix released a short teaser that only served to reveal the premiere date of its next superhero series. However, no ...
WordPress.com had announced that they were introducing Reduction in their core features and allowing their users to use it when writing their blog posts, pages, and comments. When they are added ...
I have tried almost every CRM software out there under the sun. Having spent so much time between applications makes it possible for me to make this list with the best 15 free CRMs for ...
When we browse YouTube, we see that the videos have a cover thumbnail. In several cases it is something that gives us an idea of the content, even though it does not mean ...